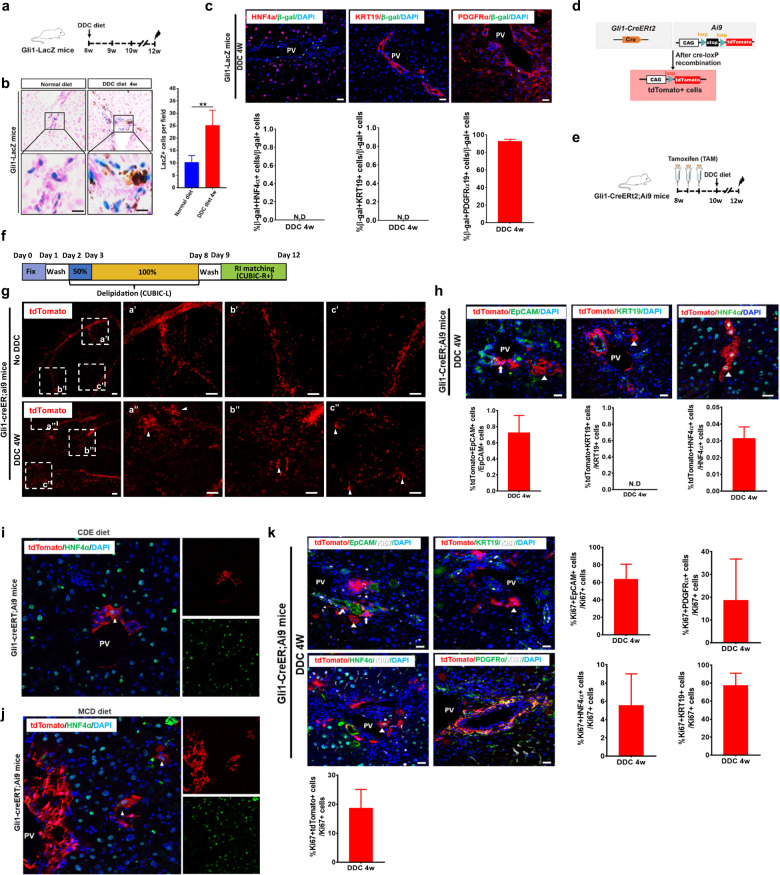
Fig. 1. Gli1+ cells are induced and generate de novo hepatocytes after chronic liver injury.
a Schematic illustration of the experimental design. b Representative histological images of X-gal-stained liver sections from Gli1-LacZ mice after 4 weeks of a normal diet or DDC diet (left panel). Quantification of the number of X-gal+ cells after injury (right panel). Data are shown as means ± SEM (n = 3). **P < 0.01. c Representative immunofluorescence staining of liver sections from mice that received a normal or DDC diet using antibodies against β-gal (green) and PDGFRα (red), HNF4α (red), or KRT19 (red). PV portal vein. Scale bars, 50 μm. Right panels: quantification of the percentage of β-gal+ cells expressing HNF4α, KRT19 and PDGFRα. Data are represented as means ± SEM (n = 5). N.D not detected. d Schematic representation of lineage tracing using Gli1-CreERt2;Ai9 reporter mice after DDC-induced liver injury. e Schematic illustration of the experimental design. f Schematic diagram of the protocol for clearing the liver from Gli1-CreERt2;Ai9 mice after 4 weeks of a normal diet or DDC diet with CUBIC. g Reconstructed 3D images of the livers of Gli1-CreERt2;Ai9 mice after 4 weeks of a normal diet or DDC diet. Images were obtained by light-sheet fluorescence microscopy (LSFM) (z-stack: 5 μm/slice). White arrowheads indicate hepatocyte morphology. Scale bars, 200 μm. h Immunostaining for tdTomato (red) and KRT19 (green), EpCAM (green) or HNF4α (green) in tissue sections from livers after Gli1-CreERt2;Ai9 mice received a DDC diet for 4 weeks. Scale bars, 50 μm. White arrowheads indicate hepatocyte morphology. White arrow indicates EpCAM+tdtomato+ cells. Right panels: quantification of the percentage of tdTomato+ cells expressing HNF4α, KRT19 and EpCAM. Data are shown as means ± SEM (n = 5). N.D not detected. *P < 0.05. i Immunostaining for tdTomato (red) and HNF4α (green) in tissue sections from livers after Gli1-CreERt2;Ai9 mice received an MCD diet for 4 weeks. White arrowhead indicates hepatocyte morphology. Scale bar, 50 μm. j Immunostaining for tdTomato (red) and HNF4α (green) in tissue sections from livers after Gli1-CreERt2;Ai9 mice received a CDE diet for 4 weeks. White arrowheads indicate hepatocyte morphology. Scale bar, 10 μm. k Immunostaining for tdTomato (red), Ki67 (white) and KRT19 (green), EpCAM (green), HNF4α (green) or PDGFRα (green) within representative liver sections at 4 weeks after DDC-induced injury. White arrowheads indicate hepatocyte morphology. White arrow indicates EpCAM+tdtomato+ cells. Scale bars, 50 μm. Right panels: quantification of the percentage of tdTomato+, KRT19+, EpCAM+, HNF4α+, or PDGFRα+ cells expressing Ki67. N.D, not detected. Data are shown as means ± SEM (n = 5).

