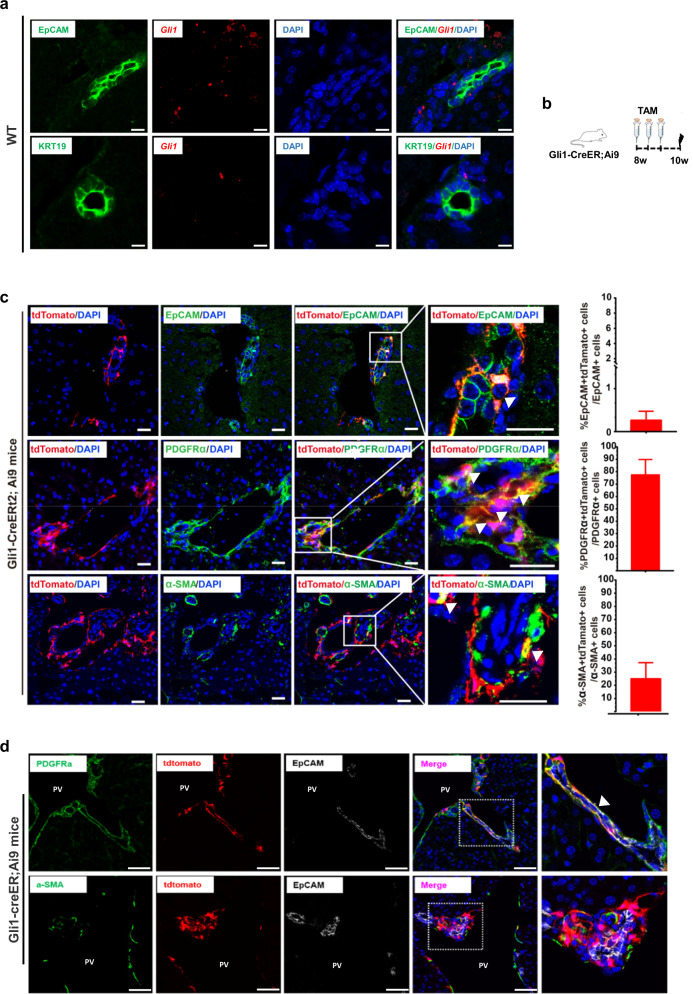
Fig. 3. Gli1 identifies a minor subset of EpCAM+ cells in the liver.
a RNAscope analysis of hepatic expression of Gli1 (red) and EpCAM (green) or CK19 (green) on 8-week-old WT mice. Scale bars, 200 μm. b Experimental design for lineage tracing of Gli1+ cells using Gli1-CreERt2;Ai9 mice. c Immunostaining for tdTomato (red) and EpCAM (green), PDGFRα (green) or α-SMA (green) on liver sections (left panels). White arrowheads indicate the co-stained cells. Scale bars, 50 μm. Quantification of the percentage of tdTomato+ cells expressing PDGFRα, EpCAM, and α-SMA (right panels). Data are presented as means ± SEM (n = 3). d Immunostaining for tdTomato (red), EpCAM (white), and PDGFRα (green) or α-SMA (green) in liver sections. PV portal vein. White arrowhead indicates the co-stained cell. Scale bars, 50 μm.

