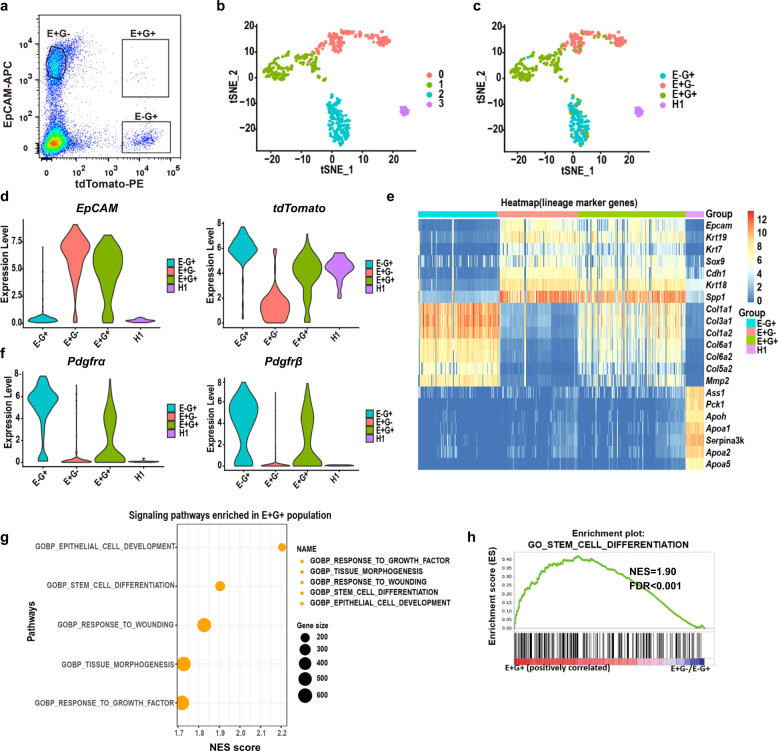
Fig. 4. Single-cell transcriptome analysis identifies cell lineages expressing EpCAM and Gli1.
a Representative profiles of FACS-sorted EpCAM+Gli1−, EpCAM−Gli1+ and EpCAM+Gli1+ cell populations from Gli1-CreERt2;Ai9 mice for scRNA-seq. b, c t-stochastic neighbor embedding (tSNE) plot of 527 individual cells isolated in a (dots). d Violin plots showing expression of EpCAM and tdTomato as determined by scRNA-seq. E+G− EpCAM+Gli1−, E−G+ EpCAM−Gli1+, E+G+ EpCAM+Gli1+, H1 hepatocyte. e Heatmap of scRNA-seq data showing enriched genes in the 4 different clusters. f Violin plots showing expression of selected specific lineage-associated genes as determined by scRNA-seq. g GO annotation of EpCAM+Gli1+ cells. h Signaling pathways that were significantly enriched in EpCAM+Gli1+ cells were identified using BioCarta gene sets for GSEA. P < 0.05. E+G− EpCAM+Gli1−, E−G+ EpCAM−Gli1+, E+G+ EpCAM+Gli1+, H1 hepatocyte.

