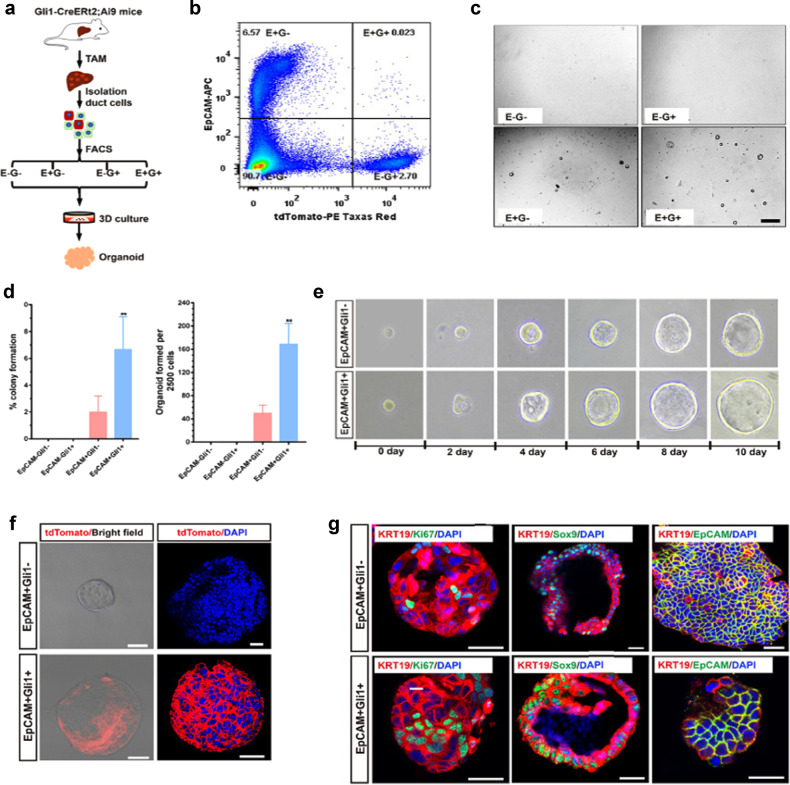
Fig. 6. Liver organoid development from EpCAM+Gli1− and EpCAM+Gli1+ single cells.
a Schematic representation of organoid development from EpCAM−Gli1−, EpCAM+Gli1−, EpCAM−Gli1+ and EpCAM+Gli1+ single cells sorted by FACS. b FACS plot showing the expression of EpCAM and Gli1 in livers from Gli1-CreERt2;Ai9 mice after TAM induction. c Representative bright-field images of EpCAM−Gli1−, EpCAM+Gli1−, EpCAM−Gli1+ and EpCAM+Gli1+ cells cultured for 3 days as liver organoids. Original magnifications: 10×. d Percentage of the colony formation efficiency (left) and the numbers of organoids formed per 2500 single cells (right). Data are presented as means ± SEM (n = 3). **P < 0.01. e Representative images of initial single seeded EpCAM+Gli1− and EpCAM+Gli1+ cells maintained in 3D culture for a period of 10 days. Original magnifications were 40× (days 0–4), 20× (days 6–8), and 10× (day 10). f Whole-mount organoid immunofluorescence staining for tdTomato (red) in organoids generated from EpCAM+Gli1− and EpCAM+Gli1+ cells. Scale bar, 50 μm. g Immunofluorescence staining for KRT19 (red) and Sox9 (green), EpCAM (green) or Ki67 (green) in organoids generated from EpCAM+Gli1− and EpCAM+Gli1+ cells. Scale bar, 50 μm.

