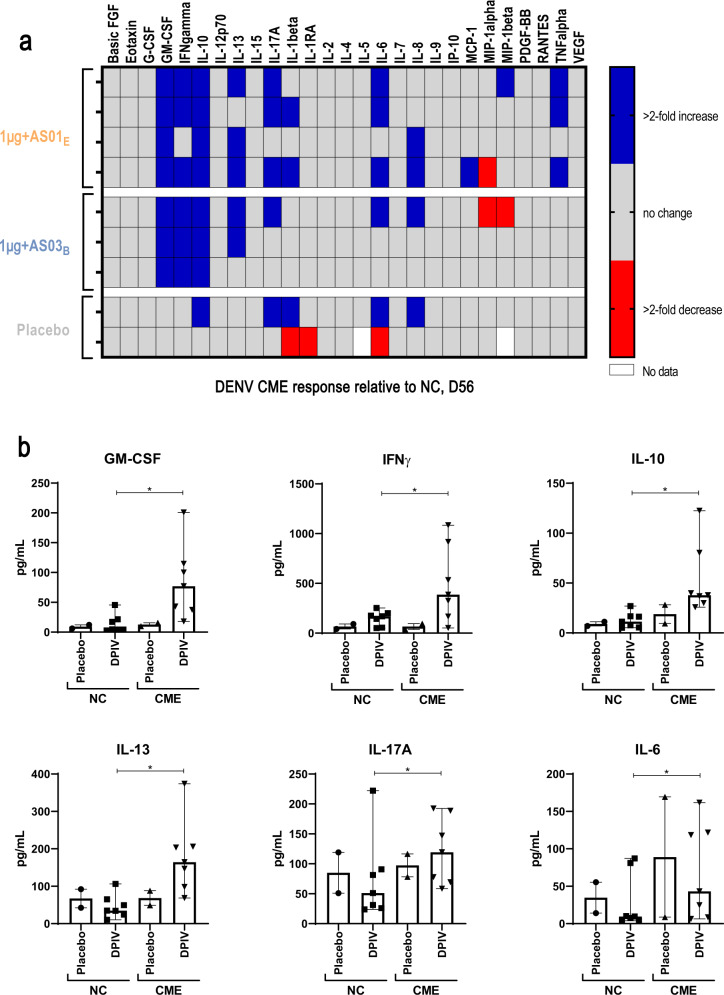
Fig. 5. Cytokine analysis of 6–7 days culture supernatants.
The panels show the difference in the production of 27 cytokines (using combined DENV capsid/pre-membrane and envelope region peptide pools) at day 56 (a) and the concentrations of cytokines showing a greater than two-fold change in at least four vaccinated individuals (b) (adapted according-to-protocol cohort for immunogenicity subset). Error bars represent the Min and Max values in each group. CME, combined capsid/pre-membrane and envelope; D, day; D56, 28 days post-dose 2; DENV, dengue virus; FGF, fibroblast growth factor; G-CSF, granulocyte colony-stimulating factor; GM-CSF, granulocyte-macrophage colony-stimulating factor; IFN, interferon; IL, interleukin; IP-10, interferon-inducible protein 10; MCP-1, monocyte chemoattractant protein-1; MIP, macrophage inflammatory protein; NC, negative control; PDGF, platelet-derived growth factor; TNF, tumor necrosis factor; VEGF, vascular endothelial growth factor. *Significant difference in the DPIV groups comparing NC vs CME stimulation as assessed by Holm-Sidak using α = 0.05; computations assumed that all time points were sampled from populations with the same scatter.

