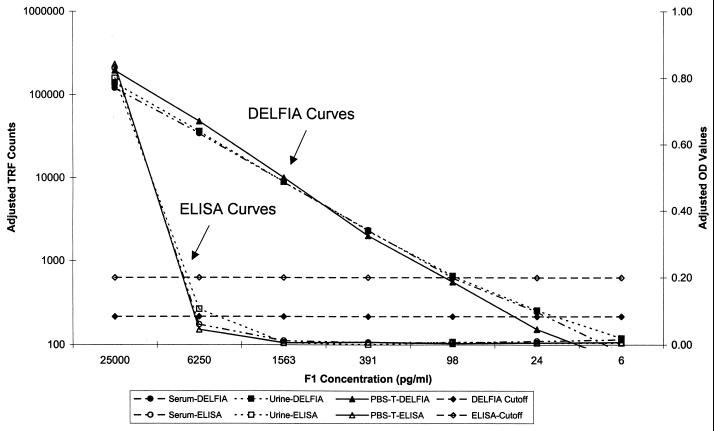
FIG. 2.
Y. pestis F1 antigen DELFIA and ELISA standard curves prepared in different sample matrices. F1 antibody negative serum, urine, and PBS-0.3T matrices were spiked with 25,000 pg of F1 antigen per ml and diluted fourfold. Three replicates of each concentration were used for each determination. DELFIA results are expressed as counts, whereas ELISA results are expressed as OD values. Assay cutoff values were equal to three times the standard deviation of negative control values (all matrices noted above) plus the average value for the same controls. The ELISA cutoff was then rounded up to the nearest tenth.

