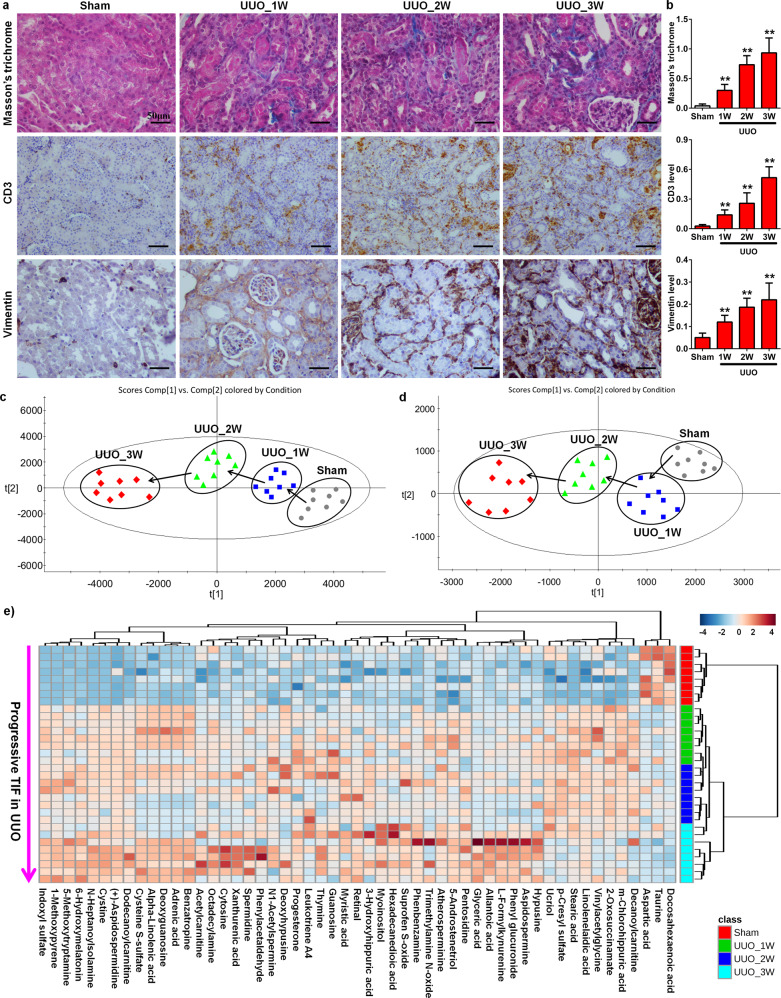
Fig. 1. UUO leads to progressive TIF and lymphocyte infiltration in UUO mice.
a Images of Masson’s trichrome staining and immunohistochemical staining of CD3 and vimentin expression at Weeks 1, 2 and 3. b The histograms refer to the relative expression of Masson’s trichrome staining, as well as vimentin and CD3 expression, in each group as indicated. c Visualisation of changes in the metabolic trajectories in UUO mice. PCA score plots of metabolic profiles for the different UUO groups at Weeks 1, 2 and 3 in positive ion mode. d Visualisation of changes in the metabolic trajectories in UUO mice. PCA score plots of metabolic profiles for the different UUO groups at Weeks 1, 2 and 3 in negative ion mode. e Heatmap of 53 metabolites in the sham and UUO groups at Weeks 1, 2 and 3. **P < 0.01 compared with the sham group.

