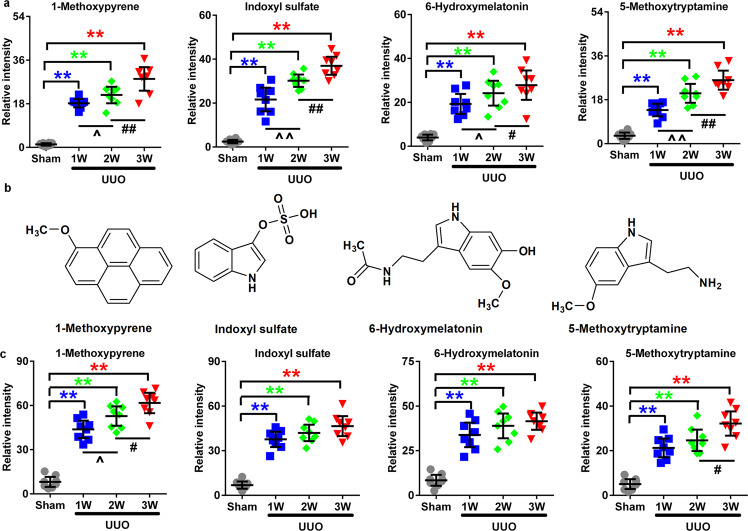
Fig. 2. UUO caused gradual increases in metabolites that paralleled progressive TIF.
a Relative intensities of four significantly altered metabolites in the obstructed kidney tissues of UUO mice at Weeks 1, 2 and 3. b Chemical structures of the four metabolites. c Relative intensities of the four significantly altered metabolites in the serum of UUO mice at Weeks 1, 2 and 3. **P < 0.01 compared with the sham group; ^P < 0.05, ^^P < 0.01 compared with the UUO group at Week 1; #P < 0.05, ##P < 0.01 compared with the UUO group at Week 2.

