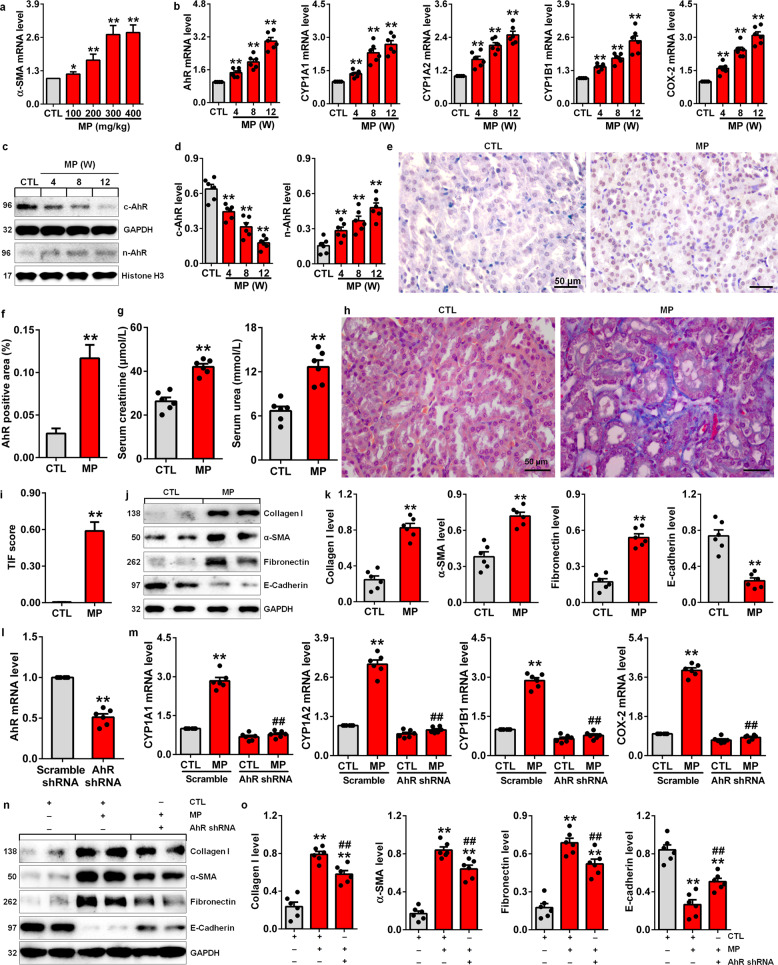
Fig. 7. AhR signalling was activated in MP-induced mice.
a α-SMA mRNA expression levels in the kidney tissues of control mice and mice treated with different doses of MP at Week 8. b The mRNA expression levels of AhR and its target genes, including CYP1A1, CYP1A2, CYP1B1 and COX-2, in the kidney tissues of control and MP-induced mice at Weeks 4, 8, and 12. c AhR protein expression in the nucleus and cytoplasm of kidney tissues from control and MP-induced mice at Weeks 4, 8, and 12. d Quantitative analysis of AhR expression in the nucleus and cytoplasm of kidney tissues from control and MP-induced mice at Weeks 4, 8, and 12. e Immunohistochemical analysis with anti-AhR of kidney tissues from control and MP-induced mice at Week 12. f Quantitative immunohistochemical analysis with anti-AhR of kidney tissues from control and MP-induced mice at Week 12. g The levels of serum creatinine and urea in control and MP-induced mice at Week 12. h Images of Masson’s trichrome staining of kidney tissues from control and MP-induced mice at Week 12. i Quantitative analysis of renal fibrosis as shown by Masson’s trichrome staining of kidney tissues in control and MP-induced mice at Week 12. j Protein expression of collagen I, α-SMA, fibronectin and E-cadherin in kidney tissues from control and MP-induced mice at Week 12. k Quantitative analysis of collagen I, α-SMA, fibronectin and E-cadherin in kidney tissues from control and MP-induced mice at Week 12. l AhR mRNA expression levels in AhR shRNA-treated mice. m The mRNA expression levels of AhR target genes, including CYP1A1, CYP1A2, CYP1B1 and COX-2, in AhR shRNA-treated mice induced with MP. n Protein expression of collagen I, α-SMA, fibronectin and E-cadherin in MP-induced mice treated with AhR shRNA. o Quantitative analysis of collagen I, α-SMA, fibronectin and E-cadherin in MP-induced mice treated with AhR shRNA. *P < 0.05, **P < 0.01 vs the CTL or CTL Scramble group; ##P < 0.01 vs the MP or MP Scramble group.

