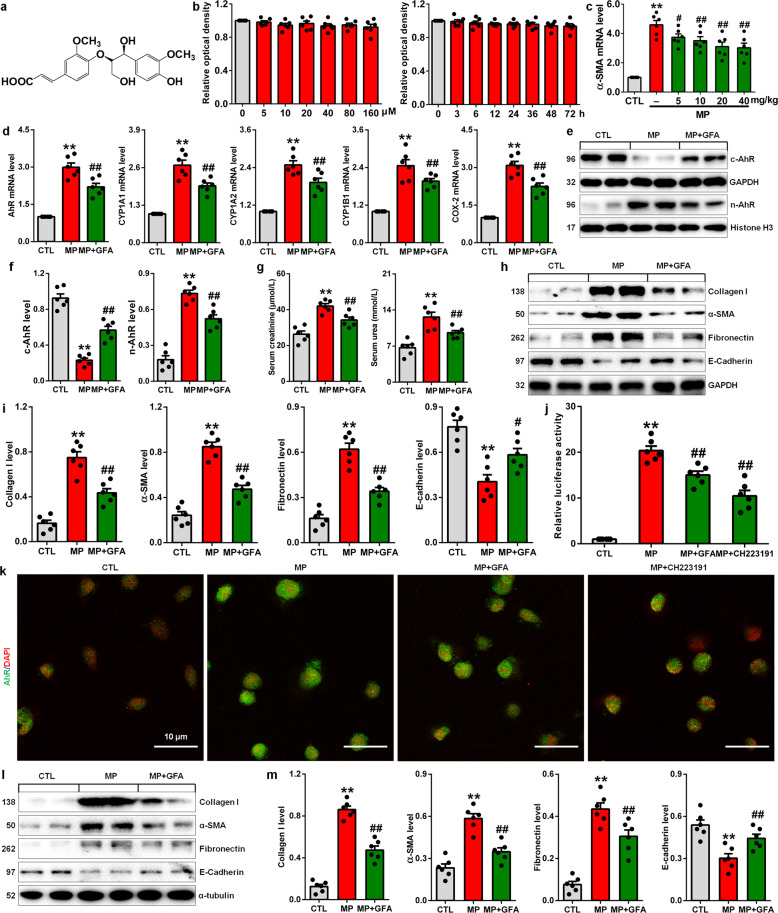
Fig. 8. GFA treatment mitigates TIF by antagonising the MP-induced AhR signalling pathway.
a Structure of GFA. b The viability of NRK-52E cells after treatment with increasing concentrations of GFA (0–160 µM) for 24 h and 20 µM for different times (0–72 h). c The effects of four doses of GFA on the mRNA expression of α-SMA in MP-induced mice at Week 12. d The mRNA expression levels of AhR target genes, including CYP1A1, CYP1A2, CYP1B1 and COX-2, in the kidney tissues in the different groups as indicated at Week 12. e AhR protein expression in the nucleus and cytoplasm of kidney tissues from the different groups at Week 12. f Quantitative analysis of AhR expression in the nucleus and cytoplasm of kidney tissues from the different groups at Week 12. g The levels of serum creatinine and urea in the different groups at Week 12. h Protein expression of collagen I, α-SMA, fibronectin and E-cadherin in the kidney tissues in the different groups at Week 12. i Quantitative analysis of collagen I, α-SMA, fibronectin and E-cadherin in the kidney tissues in the different groups at Week 12. j Luciferase assay showing AhR activation in MP-induced NRK-52E cells treated with GFA or CH223191. k Representative immunofluorescent staining of MP-induced NRK-52E cells treated with GFA or CH223191. l Protein expression of collagen I, α-SMA, fibronectin and E-cadherin in MP-induced NRK-52E cells treated with GFA. m Quantitative analysis of collagen I, α-SMA, fibronectin and E-cadherin MP-induced NRK-52E cells treated with GFA. *P < 0.05, **P < 0.01 vs the CTL group (n = 6); #P < 0.05, ##P < 0.01 vs the MP group.

