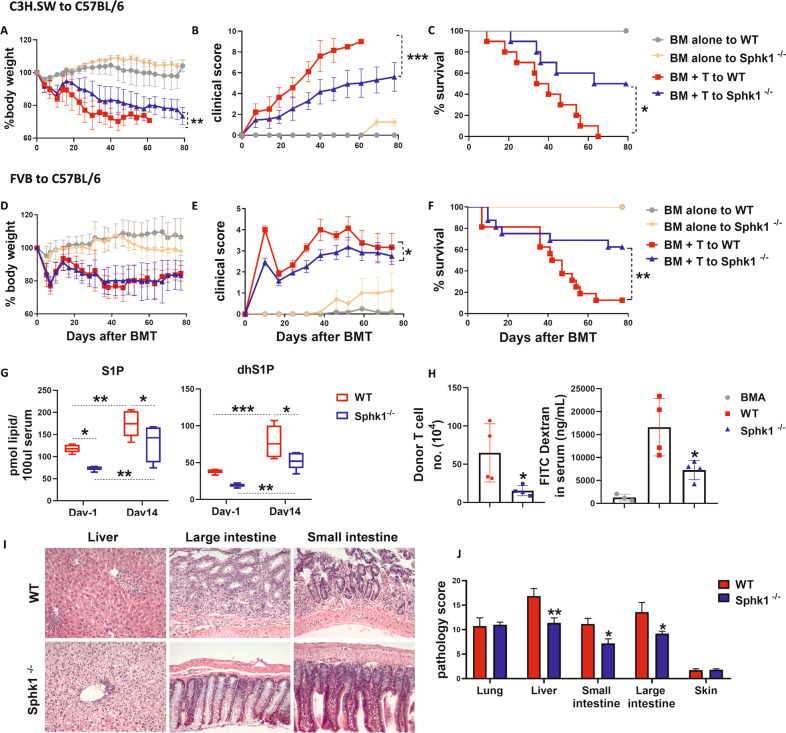
Fig. 2.
The role played by recipient Sphk1 in the development of aGVHD. Lethally irradiated C57BL/6 WT and Sphk1−/− mice (1100 cGy) were transplanted with 5 × 10⁶ TCD-BM alone or with 1.25 × 10⁶ CD44-depleted T cells isolated from a C3H cell population of SW donors. Recipients were monitored for A body weight loss, B clinical score, and C survival over time (n = 10 mice/group). Lethally irradiated C57BL/6 WT and Sphk1−/− mice (1100 cGy) were transplanted with 5 × 10⁶ TCD-BM alone or with 1 × 10⁶ total T cells isolated from FVB donors, and recipients were monitored for D body weight loss, E clinical score, and F survival over time (n = 10 mice/group). G Serum was collected from the recipient mice before and 14 days after allo-BMT and subjected to HPLC‒MS analysis for S1P and dhS1P measurement (n = 5 mice/group). Seven days after allo-BMT, WT and Sphk1−/− recipients were administered FITC-dextran (80 mg/mL, 200 μL/mouse) by gavage. H Gut permeability was evaluated on the basis of the concentration of secreted FITC-dextran in serum after an additional 4 h, and the absolute numbers of infiltrating donor T cells were calculated (n = 4 mice/group). Tissues from WT and Sphk1−/− FVB mice and transplanted into C57BL/6 mouse recipients were collected on 21 days after allo-BMT and analyzed for pathology (I, J). Representative photomicrographs showing hematoxylin and eosin staining of liver, small and large intestine at the original 200 x magnification, and pathology the scores are shown (n = 10 mice/group). “BMA” in the summary graph indicates BM alone. The experiments were repeated 2 independent times, and the combined data are presented. Log-rank (Mantel‒Cox) test (C and F) and nonparametric Mann‒Whitney U tests (A, B, D, and E) were performed to compare groups. A two-way ANOVA test (G) was used to compare the levels of S1P and dhS1P between groups. Statistical data are presented as the mean ± 1 SD, and significance was determined by Student’s t-test. *P < 0.05, **P < 0.01 and ***P < 0.001

