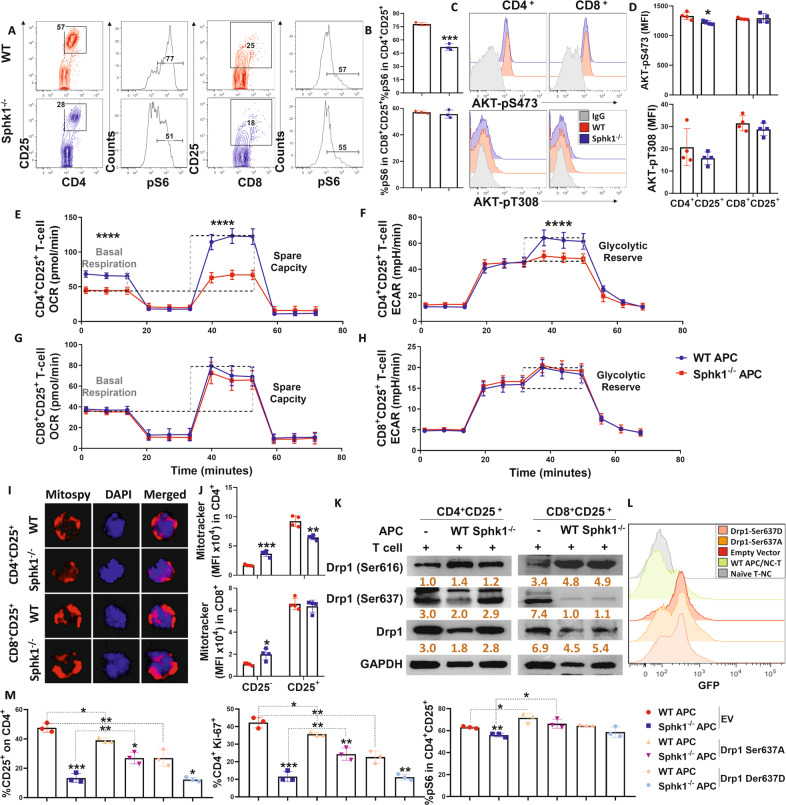
Fig. 8.
S1P regulates CD4+ T-cell pathogenicity through Akt/pS6-mediated mitochondrial fission. Purified CD25-depleted T cells from FVB mice were cocultured with APCs from either WT or Sphk1−/− mice. A, B pS6, C, D AKT-pS473 and AKT-pT308 expression in gated CD4+ CD25+ or CD8+ CD25+ T cells was measured after 3 days. Representative dot plots or histograms and average frequencies are shown. E–H Purified CD4+ or CD8+ T cells from FVB mice were cocultured with APCs from either WT or Sphk1−/− mice for 3 days, and activated CD4+ or CD8+ T cells were obtained from bulk culture with CD25 using microbeads and further analyzed with a Seahorse XF96e machine. Glycolysis and OXPHOS shifts in alloreactive T cells were determined by evaluating OCR and ECAR. I Fluorescence figures showing costaining of DAPI and MitoSpy in CD4+ and CD8+ T cells after CD25 selection are shown. J Expression of MitoTracker in CD25+ or CD25− on gated CD4+ or CD8+ T cells was detected by flow cytometry, and summary graphs are shown. K Purified CD4+ or CD8+ T cells from FVB mice were cocultured with APCs from either WT or Sphk1−/− mice for 3 days, and activated CD4+ or CD8+ T cells were obtained from bulk culture with CD25 using microbeads. Drp1, Drp1-Ser616, Drp1-Ser637 and GAPDH expression in CD4+ CD25+ or CD8+ CD25+ T cells was detected by western blotting. Purified naive CD4+ T cells from FVB mice were transfected with GFP-EV, GFP-Drp1 Ser637A, and GFP-Drp1 Ser637D DNA plasmid vectors. After 6 h, transfected T cells were collected and cocultured with TCD-splenocytes serving as APCs from WT or Sphk1−/− mice for three days, and then, CD25, pS6, and Ki-67 expression was analyzed. L GFP signal and M the average levels of CD25, pS6, and Ki-67 on gated CD4+ T cells are shown. The experiments were repeated 2 to 3 independent times. The gray intensity of each band in the western blot was measured by ImageJ. Statistical data are presented as the mean ± 1 SD, and significance was determined by Student’s t-test. *P < 0.05, **P < 0.01, ***P < 0.001 and ****P < 0.0001

