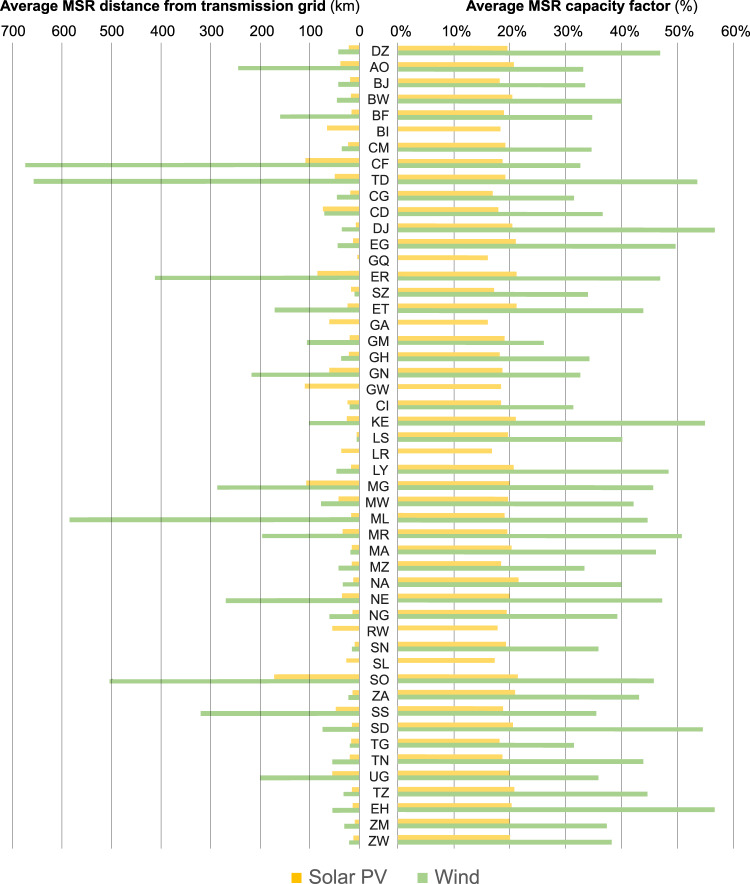
Fig. 4.
Capacity factor of MSRs as compared to their distance from the transmission grid. The left axis shows the average distance from the transmission grid across all MSRs in a country; the right axis shows the average capacity factor. Averages are weighted by MSR area. Solar PV and wind MSRs differ in (a) the spatial divergence of CFs (larger for wind than solar PV) and in (b) the distance-from-grid of the cheapest MSRs (higher for wind than solar PV). Country abbreviations denote alpha-2 codes; see Supplementary Table 4 for the list of full names. Countries are ranked vertically according to the alphabetical order of these full names. Note that some countries do not have any viable wind power potential according to the present methodology, hence bars for wind power are omitted for those countries in this graph.

