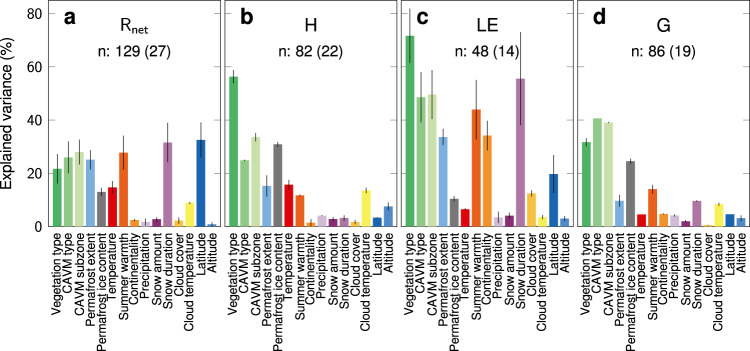
Fig. 1. Relative importance of 15 drivers of the surface energy budget (SEB) for average summer surface energy flux magnitudes at non-glacier sites.
Bars show the mean (bar height) and range (lines for each bar) of explained variance (%) averaged across all possible models with 2 predictors for each SEB-driver and corresponding summer magnitudes of surface energy fluxes (Wm−2): (a) Rnet: net radiation, (b) H: sensible heat flux, (c) LE: latent heat flux, (d) G: ground heat flux. SEB-drivers: Vegetation type (dark green): local-scale, in situ vegetation type; CAVM type (green): landscape-scale, dominant vegetation type (surrounding area with radius of 500 m); CAVM subzone (light green): bioclimatic subzone; Permafrost extent (light blue): permafrost spatial extent; Permafrost ice content (grey): permafrost ground ice content; Temperature (red): mean annual air temperature; Summer warmth (dark orange): summer warmth index; Continentality (orange): Conrad’s continentality index; Precipitation (light purple): mean annual precipitation; Snow amount (dark purple): mean annual snow water equivalent; Snow duration (purple): median annual snow cover duration; Cloud cover (light orange): mean cloud cover; Cloud temperature (yellow): mean cloud-top temperature; Latitude (dark blue): latitude (WGS84); Altitude (light blue): mean altitude (surrounding area with radius of 500 m; see Methods and Supplementary Table 1). n: average nr. of site years with average nr. of sites in parentheses. Results are based on the vegetation subset of our data (excluding glacier sites): nr. of sites: 31, nr. of site years: 234, period: 1994–2021. We repeated the analysis with additional surface energy fluxes, including normalized fluxes expressed as percentage of maximum potential incoming shortwave radiation (indicated with “n.”-prefix in Supplementary Fig. 5). Source data are provided as a Source Data file.

