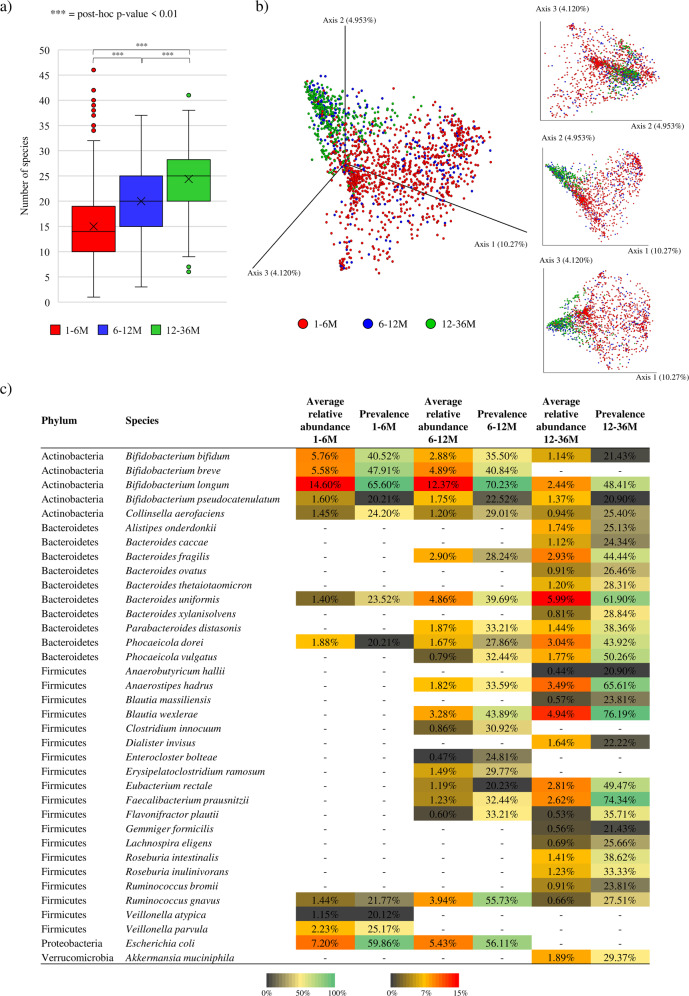
Fig. 1. Evaluation of the bacterial diversity and taxonomic composition of healthy infant fecal samples over time.
Panel a shows the box and whisker plot of the calculated species-richness based on the number of bacterial species observed in the three age group. The x-axis reports the three considered age groups, while the y-axis shows the number of bacterial species. Boxes are determined by the 25th and 75th percentiles. The whiskers are determined by the maximum and minimum values and correspond to the box extreme values. Lines inside the boxes represent the average, while crosses correspond to the median. Panel b displays both the two- and three-dimensional Bray-Curtis dissimilarity index-based PCoA of the 1669 selected infant fecal samples subdivided by age groups. Panel c reports the average relative abundance and prevalence of bacterial species corresponding to the core and accessory gut microbiota of each age group.

