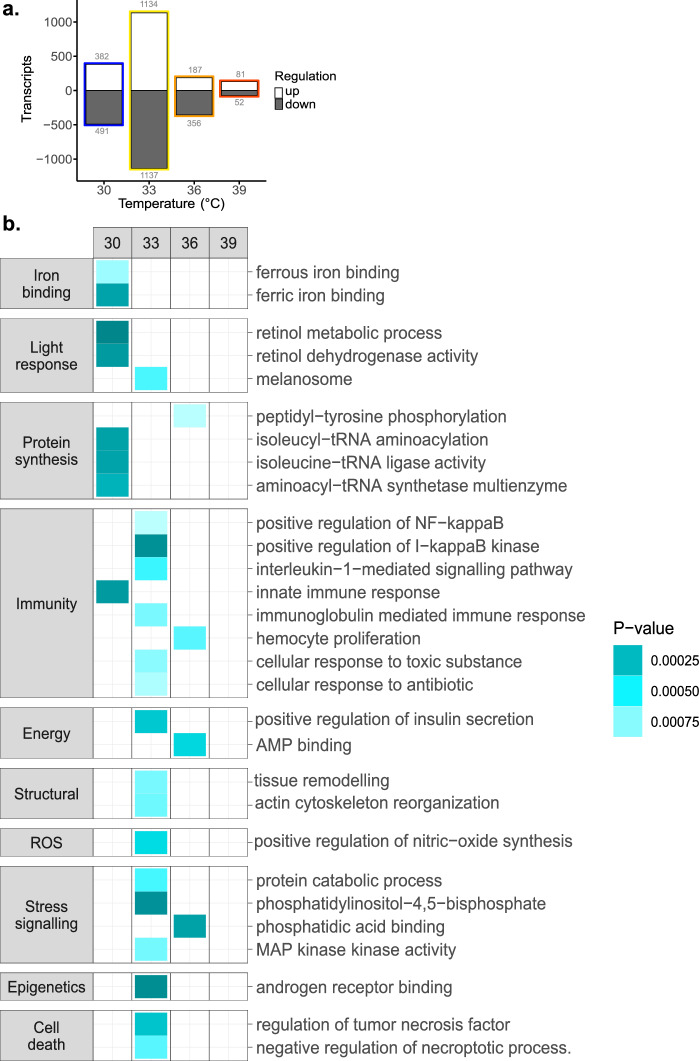
Figure 3.
Deoxygenation-specific stress responses may influence coral bleaching susceptibility. (a) Number of differentially expressed transcripts that were up- (white) and down- (grey) regulated. At each temperature (30 °C, 33 °C, 36 °C, and 39 °C) deoxygenation and normoxic conditions are compared after 6 h of the thermal profile (time point 1, Fig. 1a). (b) Heat map of gene ontology (GO) enriched terms of differentially expressed transcripts (P-value < 0.001). Comparisons (top panel) include heat & hypoxia (Hd) versus heat only (H0) within temperatures (30 °C, 33 °C, 36 °C, and 39 °C). Categories (left) manually curated for the GO terms (right). The colour gradient indicates P values, where darker turquoise is indicative of greater significance. White space indicates no GO enrichment.

