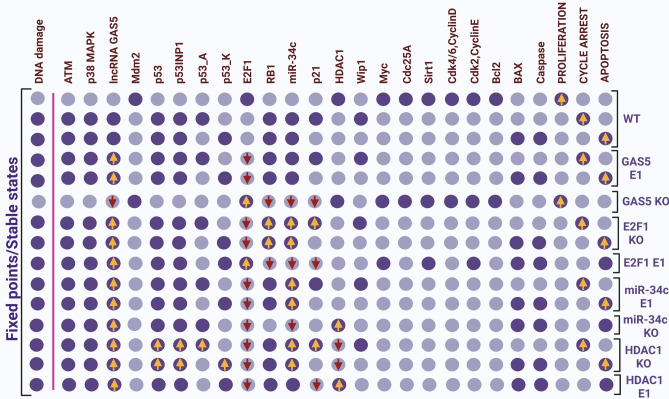
Figure 2.
Model fixed points for WT case and perturbations. The fixed points identified for distinct scenarios: WT, GAS5 E1, GAS5 KO, E2F1 KO, E2F1 E1, miR-34c E1, miR-34c KO, HDAC1 KO, HDAC1 E1, and p53 KO. Ectopic expression (E1) represents gain-of-function (GoF) while knockdown (KO) represents loss-of-function (LoF) of the respective network element. The leftmost column shows the level of DNA damage with other molecules separated by a pink line. At the same time, the rightmost columns show the model outputs: proliferation, cell cycle arrest, and apoptosis. Each line represents a fixed point or steady state corresponding to the input. Light purple cells indicate a zero value (inactivation), while dark purple cells indicate activation (value 1). The first three fixed points belong to the wild-type case. The remaining fixed points explain how GAS5 regulates the miR-34c expression, and at the end, three fixed points linked to the HDAC1/p21 pathway represent activation of p21 via knockdown of HDAC1 by miR-34c. The GoF of GAS5 accelerates miR-34c expression that triggers cell cycle arrest and apoptosis, whereas knockdown (KO) of GAS5 inhibits miR-34c expression but induces E2F1 that, triggers proliferation. Knockdown (KO) of E2F1 increases miR-34c expression that induces cycle arrest and apoptosis, whereas its gain of function (GoF) inhibits miR-34c expression. Overexpression of miR-34c induces cell cycle arrest and apoptosis, whereas knockdown (KO) triggers apoptosis. Next, the knockdown (KO) of HDAC1 enhanced p21 expression, which means induction of cell cycle arrest, and apoptosis. In comparison, its gain-of-function (GoF) inhibits p21 expression and induces apoptosis. Yellow arrows represent upregulation, while the red arrows facing down represent downregulation, respectively.

