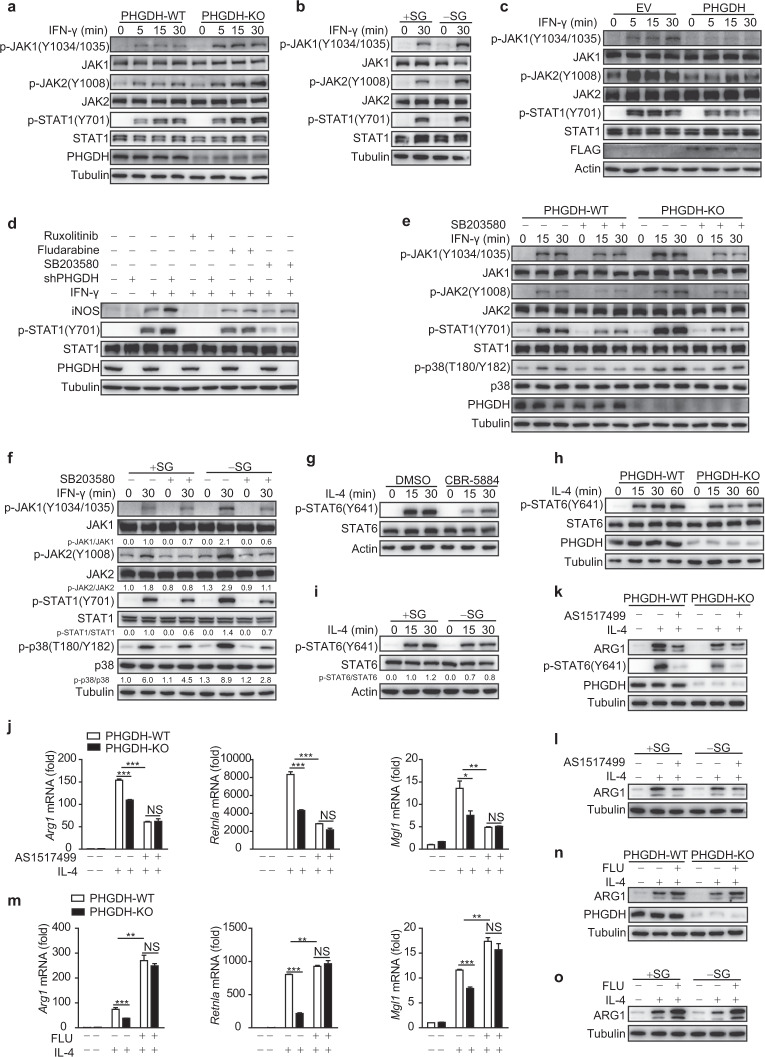
Fig. 4.
Serine metabolism modulates macrophage polarization through the p38–JAK–STAT1 signaling axis. a–i Western blot analyses were performed with the indicated antibodies. PHGDH-WT and PHGDH-KO BMDMs were treated with IFN-γ for the indicated times (a). WT BMDMs were starved of SG for 12 h and were then treated with IFN-γ for 30 min (b). RAW264.7 cells were transfected with the PHGDH ectopic expression plasmid and were then stimulated with IFN-γ for the indicated times (c). RAW264.7 cells were transfected with siControl or siPHGDH, treated with JAK (ruxolitinib), STAT1 (fludarabine), or p38 (SB203580) inhibitors for 6 h, and were then stimulated with IFN-γ for 12 h (d). PHGDH-WT and PHGDH-KO BMDMs were pretreated with the p38 inhibitor SB203580 for 6 h and were then stimulated with IFN-γ for the indicated times (e). WT BMDMs were starved of SG for 12 h, treated with the p38 inhibitor SB203580 for 6 h, and then stimulated with IFN-γ for 30 min (f). WT BMDMs were pretreated with the PHGDH inhibitor CBR-5884 for 6 h and were then stimulated with IL-4 for the indicated times (g). PHGDH-WT and PHGDH-KO BMDMs were stimulated with IL-4 for the indicated times (h). WT BMDMs were starved of SG for 12 h and were then stimulated with IL-4 for the indicated times (i). PHGDH-WT and PHGDH-KO BMDMs were pretreated with the STAT6 inhibitor AS1517499 for 6 h and were then stimulated with IL-4 for 24 h, followed by analysis of M2 markers by qRT‒PCR (j) or western blotting (k). l WT BMDMs were starved of SG for 12 h, treated with AS1517499 for 6 h, and then stimulated with IL-4 for 24 h, followed by analysis of ARG1 by western blotting. PHGDH-WT and PHGDH-KO BMDMs were pretreated with the STAT1 inhibitor fludarabine for 6 h and were then stimulated with IL-4 for 24 h, followed by analysis of M2 markers by qRT‒PCR (m) or western blotting (n). o WT BMDMs were starved of SG for 12 h, treated with fludarabine for 6 h, and then stimulated with IL-4 for 24 h, followed by analysis of ARG1 by western blotting. The data are from three independent experiments with biological duplicates in each and are shown as the mean ± SEM values (n = 3) (j, m) or are representative of three independent experiments (a–i and k, l, n, o); NS not significant (p ≥ 0.05); *p < 0.05; **p < 0.01, ***p < 0.001

