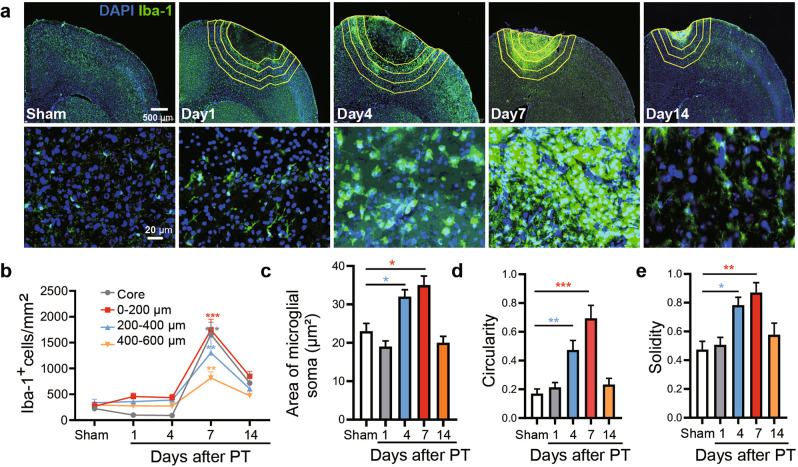
Fig. 6. Microglia activation in the progressive stroke.
a Representative images showing the immunostaining of microglia (Iba-1) surrounding the infarct core at indicated time after photothrombosis (PT). The distance from ischemic core area is depicted by the yellow lines and the distance between the polylines is 200 μm. The lower representative images showing the morphology of microglia in the upper panels between 0 and 200 μm. b Quantification of microglia at different distances from the ischemic core on Day1, 4, 7, 14 after PT. c–e Quantitative analysis of the morphology of microglia. All results were represented as means ± SEM (n = 3 animals in each group). Statistical significance was determined using one-way ANOVA with Tukey’s post hoc test, *P < 0.05, **P < 0.01 and ***P < 0.001 vs. Sham.

