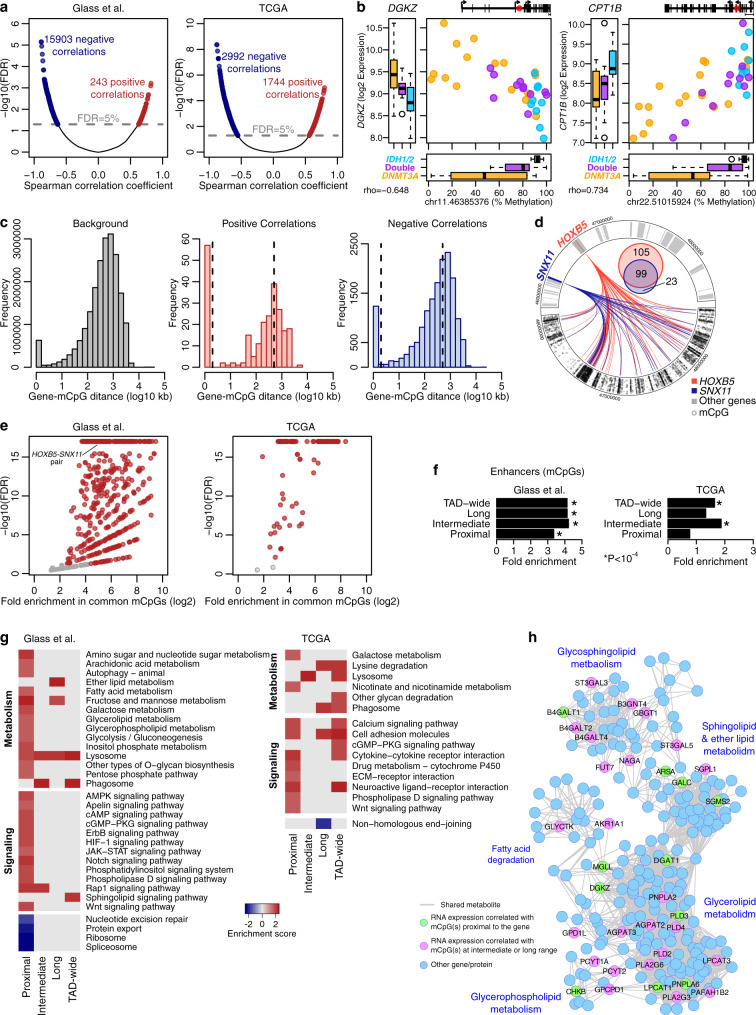
Fig. 1. DNA methylation as a regulator of gene expression in signaling and metabolic genes.
a Volcano plots showing the statistical significance of each mCpG-mRNA correlation vs. the correlation coefficient. b Examples of expression-methylation correlations. The graph at the top-right corner depicts the position of the mCpG with respect to the gene locus. The 5’-most as well as the closest transcriptional start sites downstream and upstream to the mCpG are noted. Box plots show the median (center), 25–75 percentile (box), and 5–95 percentile (whisker) from n = 16, 9 and 11 DNMT3A, IDH1/2 and double mutant samples, respectively. c Histograms of the distance between the mCpG and the gene for all pairs tested (left) and for the significant positive (middle) and negative (right) correlations in the Glass et al. cohort. Note the differences in the scales of the Y axes. Dashed lines indicate the distance cutoffs for classifying correlations. Asterisks indicate significant enrichments in the positive (n = 243; p value < 10−5) or negative (n = 15,904; p value < 10−5) proximal correlations (one-sided Chi-squared test). d Circus plot of the TAD containing the HOXB cluster illustrating the correlations of HOXB5 and of SNX11 with mCpGs in the Glass et al. cohort. The two tracks are symmetric; the top visualizes the genes and the bottom the mCpGs. The Venn diagram shows the number of mCpGs correlated with each gene. e Scatter plot of fold enrichment in the mCpGs commonly correlated with two genes against the respective FDR (one-sided Hypergeometric test). Each dot represents a gene pair, e.g., HOXB5 and SNX11. f Bar plot showing the enrichment of enhancers in the mCpGs with significant correlations (n = 10,959 for Glass et al. and n = 3549 for TCGA). Asterisks indicate p value < 10−4 (one-sided Hypergeometric test). g Pathways significantly enriched or depleted in the gene list ranked by correlation strength per GSEA. The full list of pathways is included in Supplementary Data 3. h Visualization of lipid metabolism genes with significant expression-methylation correlations. Two genes are connected if they use or produce the same metabolite. Genes are colored based on the distance bin with green prevailing purple. Source data are provided as a Source Data file.

