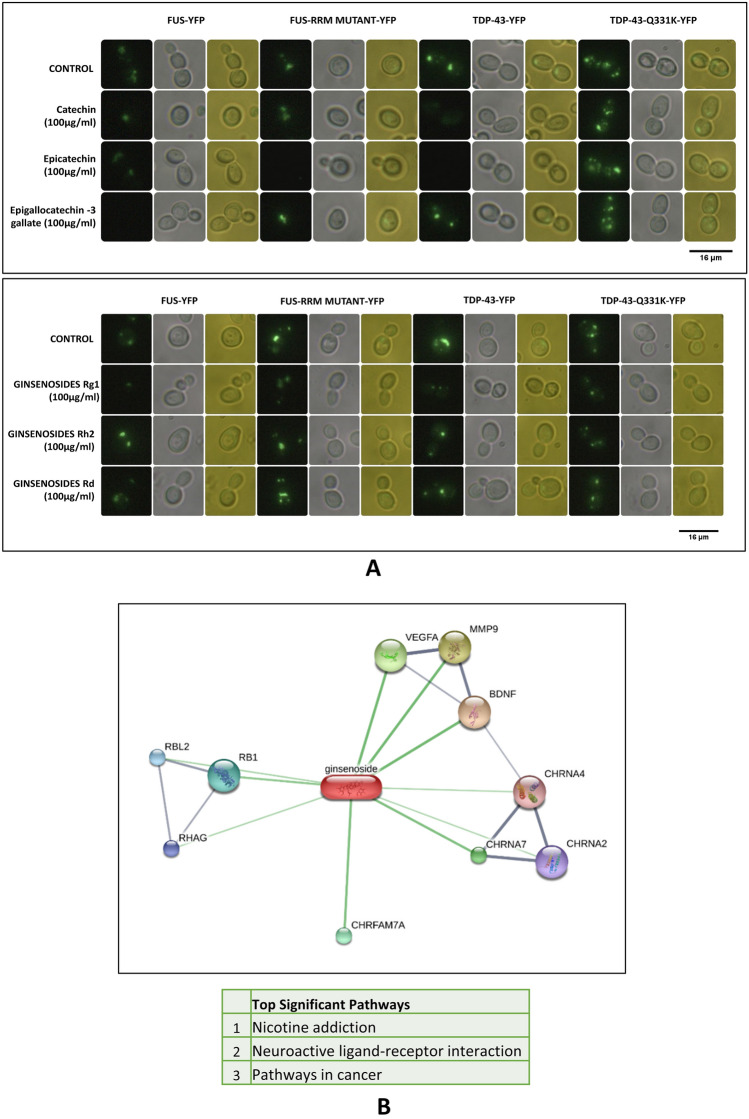
Fig. 2.
A Showing Fluorescence Microscopy results of yeast expressing FUS and TDP‒43 Wild type and Mutants exposed to different catechin derivatives and ginsenosides. Epicatechin and Rg1 showed a considerable reduction in protein aggregates of FUS and TDP-43. Imaging was carried out in the dark field (blue light) and white light. Images were arranged using PhotoScape. Fluorescence quantification was carried out using ImageJ software. Quantification results are provided in Supplementary-2. B Network file representing interacting proteins with Ginsenosides. Further, pathway enrichment analysis for the interacting proteins was carried out using Enrichr. Three pathways (nicotine addiction, neuro-active receptor–ligand interaction and pathways in cancer) were found to be significant. The network file was created using the STITCH database (stitch.embl.de)

