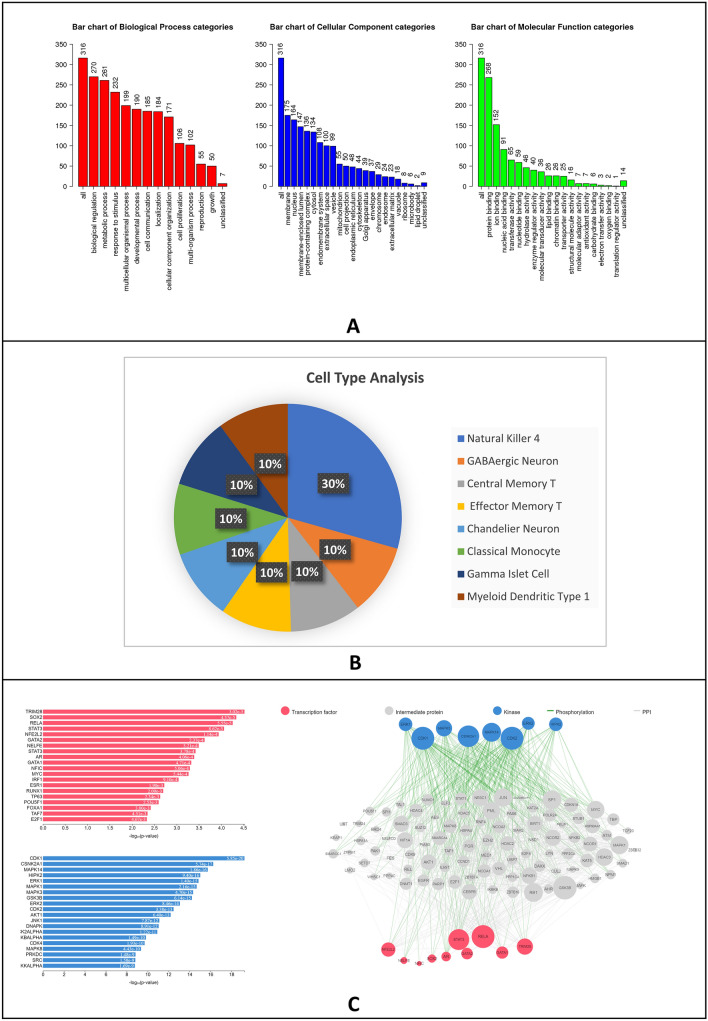
Fig. 4.
A Bar graph representing results obtained from biological processes, cellular components and molecular functions. The graphs were made using the GSEA toolkit (webgestalt.org). B Pie chart representing results obtained from Cell type analysis of interacting proteins with catechin derivatives. The pie chart was made using Enrichr, Azimuth database and Microsoft Excel 2019. C Bar graph and network file representing results obtained from transcription factor and kinase enrichment analysis of proteins that interact with catechin derivatives. Figures were made using X2K website (maayanlab.cloud/X2K)

