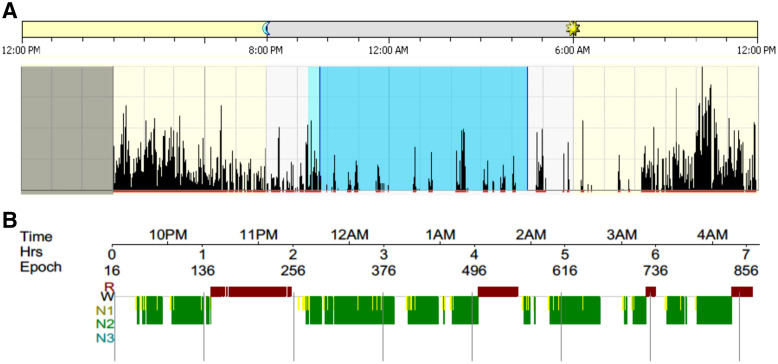
Figure 1. Patient example of hypnogram (PSG) and actogram (actigraphy) for sleep period.
Example of a patient’s hypnogram (a graphical representation of sleep period from PSG) and actogram (a graphical representation of sleep period from actigraphy) for the same time period. (A) Actogram: The black lines indicate activity as measured by actigraphy and the dark blue shaded area indicates sleep time. This patient displayed increased movement (black activity lines) throughout their sleep period. (B) Hypnogram: The colored blocks represent each stage of sleep as indicated on the left, and the white gaps indicate wake time. For this patient, the majority of sleep was spent in N1 and N2 with no N3 (deep sleep). N1 = nonrapid eye movement stage 1, N2 = nonrapid eye movement stage 2, N3 = nonrapid eye movement stage 3, PSG = polysomnography, R = rapid eye movement, W = wake time.

