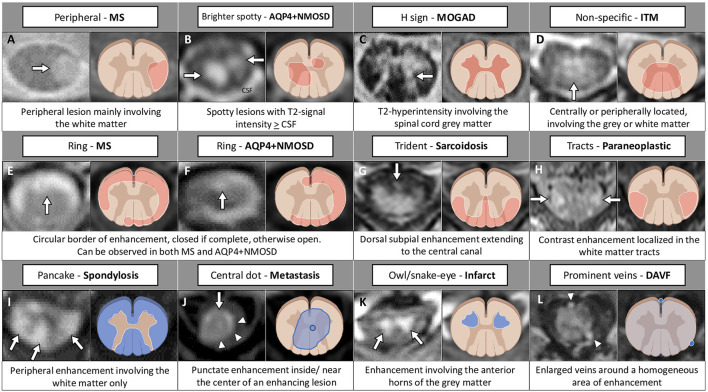
Figure 4.
MRI and corresponding schematic representation of key findings on axial view of inflammatory myelopathies and their mimics. Each finding, labeled by a letter (A–L), is shown on the most appropriate magnetic resonance imaging sequence (e.g., T2-weighted image in the top row; post-contrast T1-weighted image in the bottom rows), a brief description is provided. Red color indicates inflammatory myelopathies, while blue color indicates their mimics. The figure was created with BioRender.com. The arrowheads in (J) highlight a peripheral area of enhancement surrounding the central dot sign; in (L) indicate two veins visible around the area of enhancement. AQP4+NMOSD, aquaporin-4-IgG-positive neuromyelitis optica spectrum disorders; CSF, cerebrospinal fluid; DAVF, dural arteriovenous fistula; ITM, idiopathic transverse myelitis; MOGAD, myelin oligodendrocyte glycoprotein antibody-associated disease; MS, multiple sclerosis.

