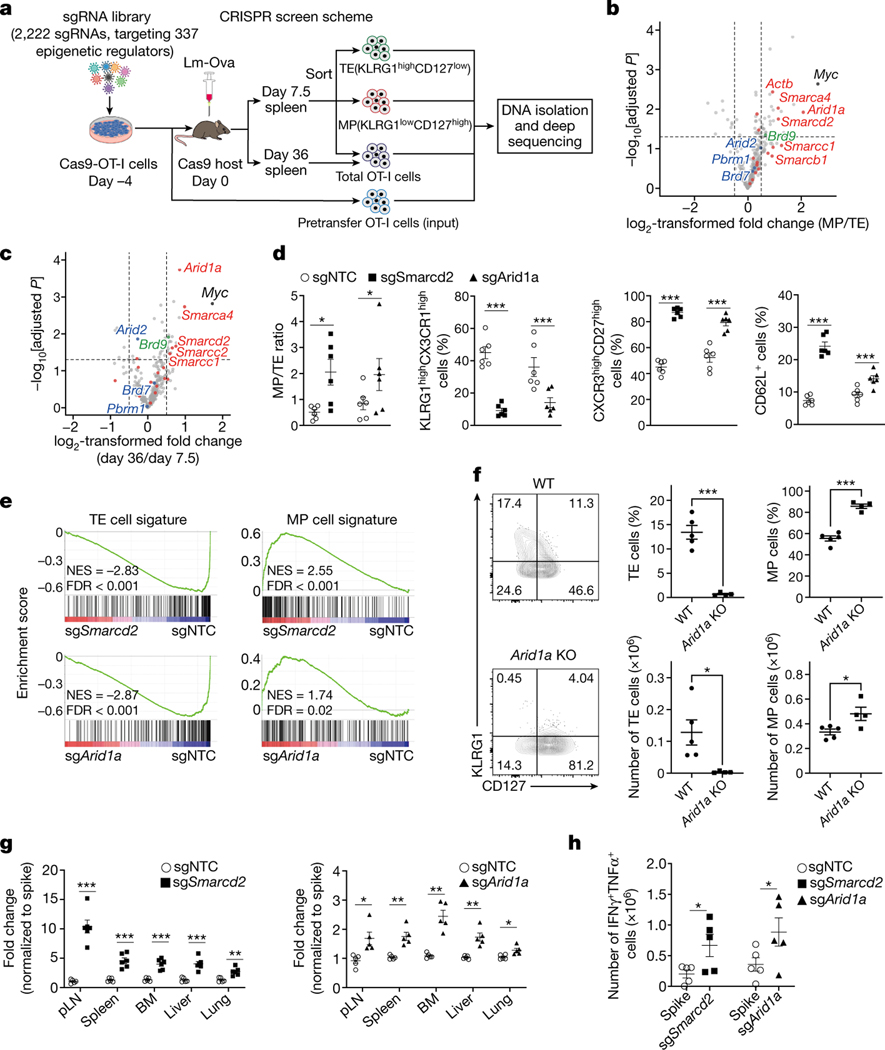
Figure 1. An in vivo CRISPR-Cas9 screen reveals a key role of the cBAF complex in T cell fate decisions.
a, Diagram of the screening system. MP, memory precursor cells (KLRG1loCD127hi); TE, terminal effector cells (KLRG1hiCD127lo). b,c, Volcano plot of the enrichment of sgRNAs in MP relative to TE cells [log2 fold change (MP/TE)] at day 7.5 post-infection (b) or in total cells at day 36 relative to total cells at day 7.5 post-infection (c). BAF components (red), PBAF components (blue) and an ncBAF component (green) are highlighted. b. n=3 replicates (each pooled from 2 mice); c. n=3 replicates (each pooled from 5 mice). d, Quantification of splenic MP/TE ratio and the proportions of TE (KLRG1hiCX3CR1hi) or memory (CXCR3hiCD27hi and CD62L+) populations in the indicated sgRNA-transduced OT-I cells at day 7.5 (n=6 mice). e, Gene set enrichment analysis (GSEA) of the TE or MP cell signatures in sgSmarcd2 or sgArid1a compared to sgNTC-transduced cells at day 7.5 post Lm-Ova infection (n=4 mice). f, Flow cytometry plot (left) and quantification (right) of splenic MP and TE cells at day 9 after IAV-Ova infection. Rosa26CreERT2Arid1afl/fl OT-I and and WT OT-I from littermates treated with oral tamoxifen, and then transferred into C57BL/6 hosts followed by IAV-Ova infection (WT, n=5 mice; Arid1a KO, n=4 mice). g, Quantification of the relative fold change (normalized to spike) of OT-I cells expressing indicated sgRNA in multiple tissues at day >30 post-infection (n=5 mice). h, Quantification of absolute number of IFN-γ+TNF-α+ cells at day 6 after Lm-Ova re-challenge (n=5 mice). Data are representative of one (b, c, e) or two (f) independent experiment; or compiled from two (d, h) or three (g) independent experiments. Data are shown as mean± s.e.m. *p<0.05, **p<0.01, ***p<0.001; two-tailed paired Student’s t-test (d, h) or two-tailed unpaired Student’s t-test (b, c, f, g).

