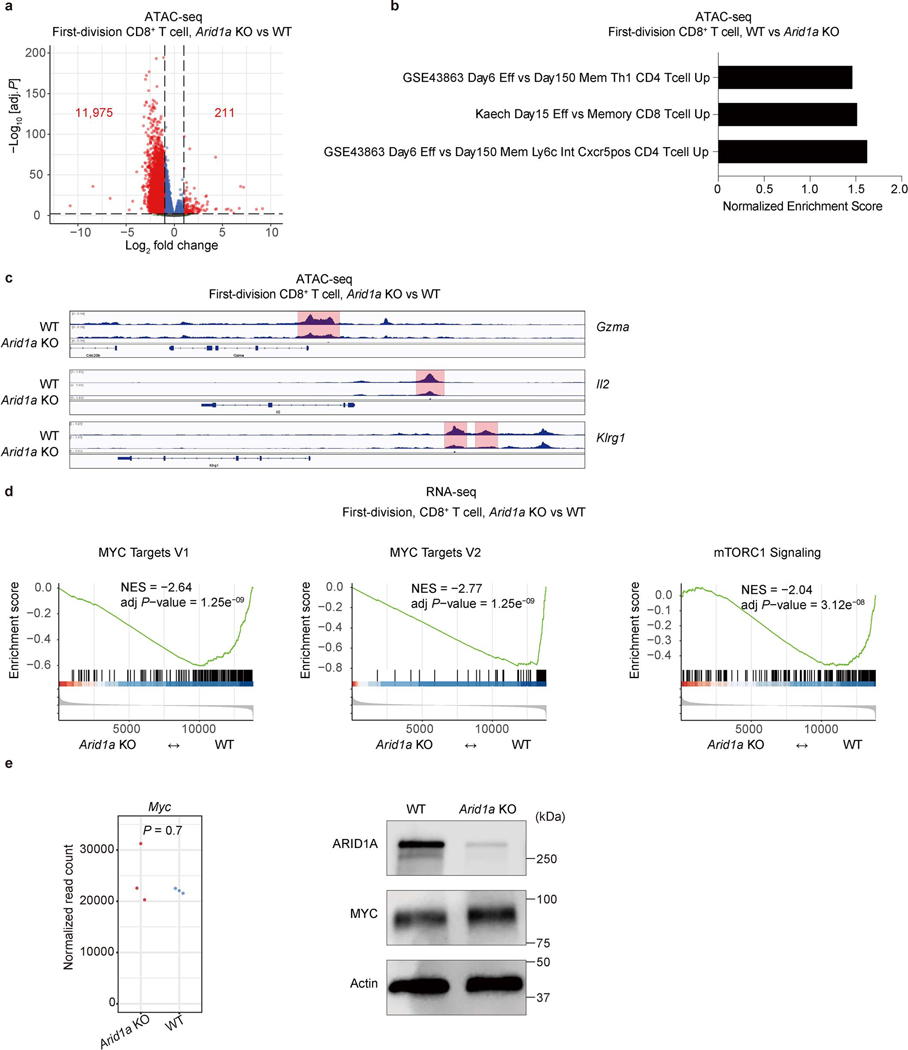
Extended Data Figure 6. Arid1a deletion reduces chromatin accessibility to sites associated with the TEFF gene signature.
a, Volcano plot of ATAC-seq peaks from WT and Arid1a−/− first-division CD8+ T cells (n=3 biological replicates). b, TEFF and TMEM cell-associated gene sets as analyzed by enrichment analysis of differentially accessible chromatin peaks between first-division WT and Arid1a−/− CD8+ T cells (n=3 biological replicates). c, Genome browser tracks of chromatin accessibility at Gzma, Il2 and Klrg1 loci (n=3 biological replicates). d, Gene set enrichment analysis of Myc targets and mTORC1 signaling gene sets in WT and Arid1a−/− first-division CD8+ T cells from RNA-seq (n=3 biological replicates). e, Normalized read count of Myc mRNA from RNA-seq (left), and immunoblot for c-Myc (right) in WT and Arid1a−/− activated CD8+ T cells. (n=3 biological replicates) p-value was calculated with two-sided Wilcoxon test. Data are representative of one (a−e, RNA-seq) or three (e, immunoblot) experiments. The p-value was calculated with Wald test, two-sided and adjusted with Benjamini-Hochberg procedure (a) or permutation test, two-sided and adjusted with Benjamini-Hochberg procedure (d).

