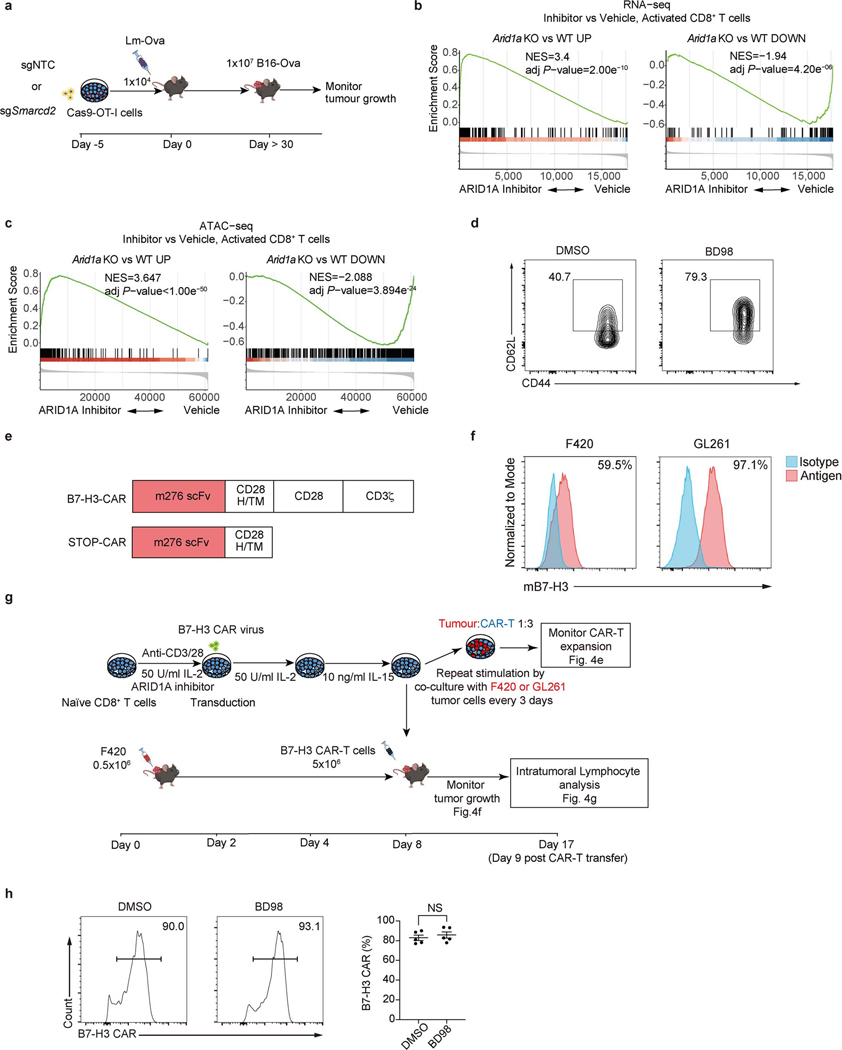
Extended Data Figure 8. Pharmacological or genetic inhibition of cBAF promotes CD8+ TMEM generation and tumor control.
a, Diagram of tumor rechallenge assay used in Fig. 4a. b, Gene set enrichment analysis of Arid1a knockout (KO) upregulated gene sets and Arid1a KO downregulated gene sets in CD8+ T cells activated for 48 hours in the presence of BD98 versus vehicle. Arid1a KO upregulated and downregulated genes sets were inferred as differentially expressed genes from RNA-seq data of Arid1a KO versus WT activated CD8+ T cells, with thresholds FDR<0.05, fold change>2. c, Peak set enrichment analysis of Arid1a KO upregulated and downregulated chromatin accessibility signatures in CD8+ T cells activated for 48 hours in the presence of BD98 versus vehicle. Arid1a KO upregulated and downregulated ATAC-seq peaks sets were inferred as differentially accessible regions from ATAC-seq of Arid1a KO versus WT activated CD8+ T cells with thresholds FDR<0.05, fold change>2, the top 500 down-regulated peaks (ranked by fold change) were used to avoid inaccurate normalization. d, Representative flow cytometry plot of the frequency of CD44+CD62L+ cells among OT-I CD8+ T cells treated with DMSO or BD98 during anti-CD3/CD28 stimulation with IL-2 for 48 h, followed by culturing in IL-2 containing medium for another 2 days. e, Scheme of murine B7-H3-CAR and STOP-CAR constructs. H/TM: hinge/transmembrane domain. f, Flow cytometry analysis of B7-H3 expression in F420 and GL261 cell lines. The percentage of B7-H3-expressing cells is indicated. g, Diagram of CAR-T cell experiment. h, Flow plot (left) and quantification (right) of B7-H3 CAR expression at day 8 with or without BD98 pretreatment (n=5 biological replicates). Data are representative of at least three independent experiments (d, f, h). Data are shown as mean±s.e.m. ns, not significant; two-tailed unpaired Student’s t-test (h). The p-value was calculated from permutation test, two-sided and adjusted with Benjamini-Hochberg procedure (b,c).

