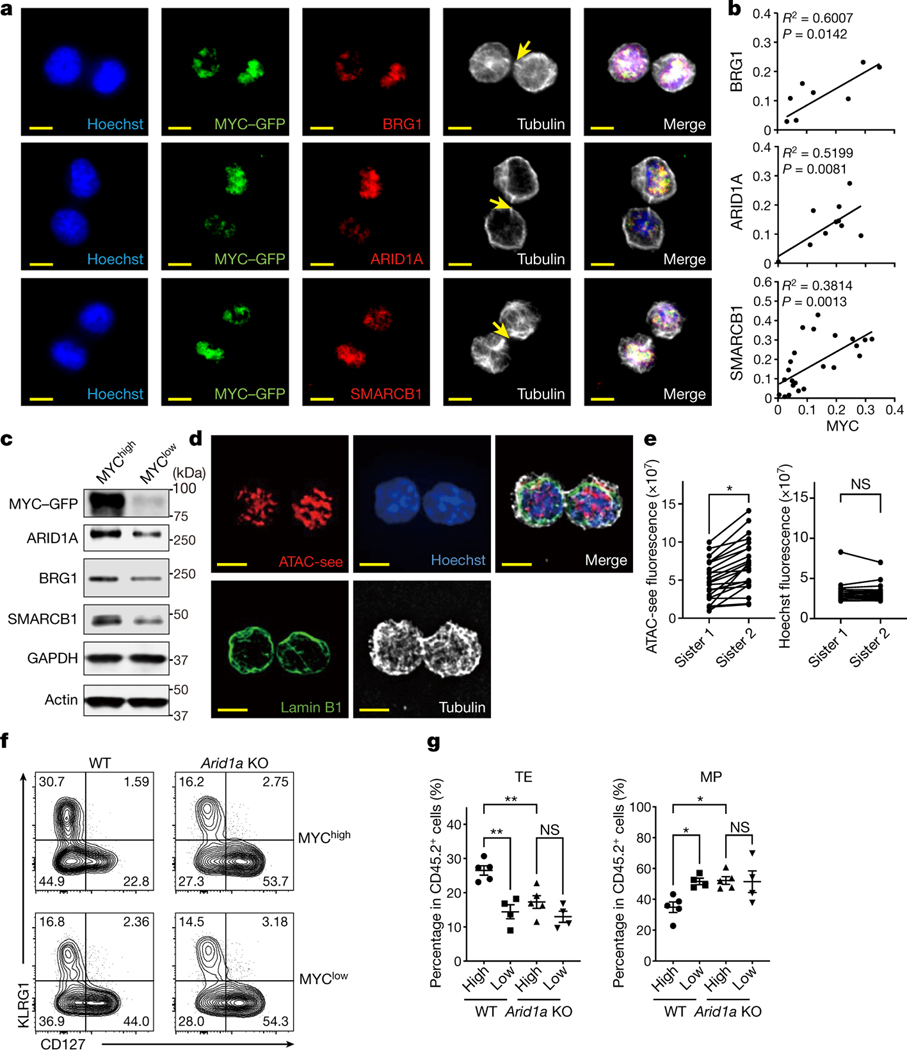
Figure 2. cBAF asymmetrically segregates to daughter cells in activated CD8+ T cells during the first division.
a, Representative images of conjoined daughter c-Myc-GFP-expressing CD8+ T cells that were fixed and stained for Hoechst (blue), cBAF components (red) and Tubulin (white). Naïve CD8+ T cells were activated by anti-CD3ε (2 μg/ml) and anti-CD28 (1 μg/ml) plus ICAM1 (0.5 μg/ml) for 28 hours. Arrows mark tubulin bridges. Scale bar: 5 μm. b, Quantification of difference in fluorescence intensity/total of BAF components (y-axis) and c-Myc-GFP (x-axis). Each point represents one pair of conjoined daughter cells (Brg1, R2=0.6007, p=0.0142 linear regression, n=9; Arid1a, R2=0.5199, p=0.0081 linear regression, n=12; Smarcb1, R2=0.3814, p=0.0013 linear regression, n=24). c, Immunoblot of BAF components in sorted c-Myc-GFPhi and c-Myc-GFPlo first-division CD8+ T cells activated as in (a) for 36 hours. The gating strategy is in Extended Data Fig. 4b. d, Representative images of conjoined daughter CD8+ T cells activated as in (a) for 28 hours and stained for ATAC-see (red), Hoechst (blue), Lamin B1 (green) and Tubulin (white). Scale bar: 5 μm. e, Quantification of fluorescence intensity of ATAC-see and Hoechst in conjoined sister CD8+ T cells. Each dot represents one cell; data points of sister cells are connected by a line (n=22 cells). f, g, Strategy is shown in Extended data Fig. 4h. Flow cytometry plot (f) and quantification (g) of donor-derived splenic TE (KLRG1hiCD127lo) and MP (KLRG1loCD127hi) cells at day 9 after IAV-Ova challenge (c-Mychi, n=5 mice; c-Myclo, n=4 mice). Data are representative of at least two independent experiments (a−g). Data are shown as mean±s.e.m. *p<0.05, **p<0.01; two-tailed paired Student’s t-test (e) or one-way ANOVA (g).

