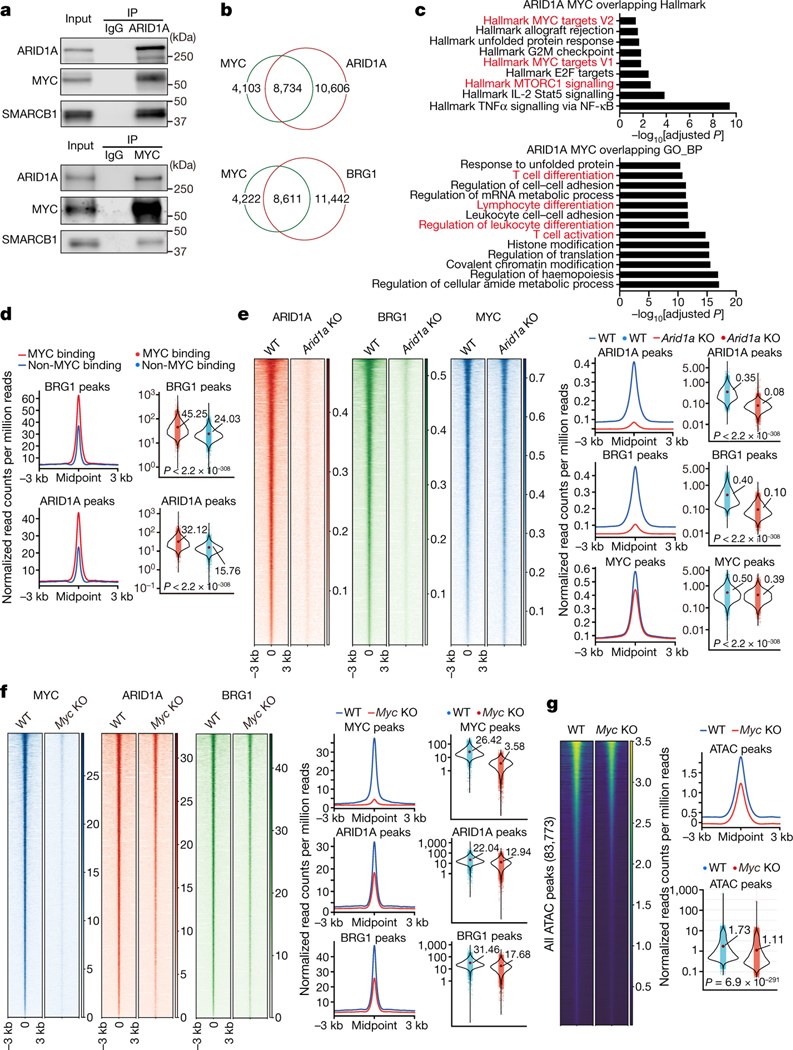
Figure 3. c-Myc interacts with the cBAF complex and enhances cBAF chromatin binding and function.
a, Endogenous interactions of Arid1a/Smarcb1/c-Myc were analyzed by co-immunoprecipitation (Co-IP). OT-1 were activated as in Fig. 2a for 36 hours. b–e, WT and Arid1a−/− naïve CD8+ T cells were labeled with CellTrace Violet and activated as in Fig. 2a for 36 hours; first-division CD8+ T cells were sorted for CUT&RUN assay (n=2 biological replicates). b, Venn diagram of the overlap between CUT&RUN binding peaks in WT first-division CD8+ T cells for c-Myc, Arid1a and Brg1. c, Over-representation analysis of Arid1a and c-Myc overlapping binding sites. d, Histogram (left) and quantification (right) of Brg1 (upper) and Arid1a (lower) binding signals (read count per million reads normalized to spike-in) in c-Myc binding sites or non-c-Myc binding sites. e, Heatmap (left), histogram (middle) and quantification (right) of Arid1a, Brg1 and c-Myc CUT&RUN signals in WT and Arid1a−/− activated first-division CD8+ cells. Mid, middle. f, g, Naïve CD8+ T cells from Rosa26Cre-ERT2Mycfl/fl mice and WT littermates were treated with 4OHT overnight in IL-2-containing media prior to activation for 36 hours. f, Heatmap (left), histogram (middle) and quantification (right) of c-Myc, Arid1a, Brg1 CUT&RUN signals (read count per million reads normalized to spike-in) in WT and c-Myc−/− activated CD8+ T cells (n=2 biological replicates). g, Heatmap and quantification of all consensus ATAC-seq peaks in WT and c-Myc−/− activated CD8+ T cells (n=3 biological replicates). Data are representative of three (a) or one experiment (b–g). Significance was calculated by one-sided hypergeometric distribution and adjusted with Benjamini-Hochberg procedure (c), or two-tailed unpaired Student’s t-test (d–g).

