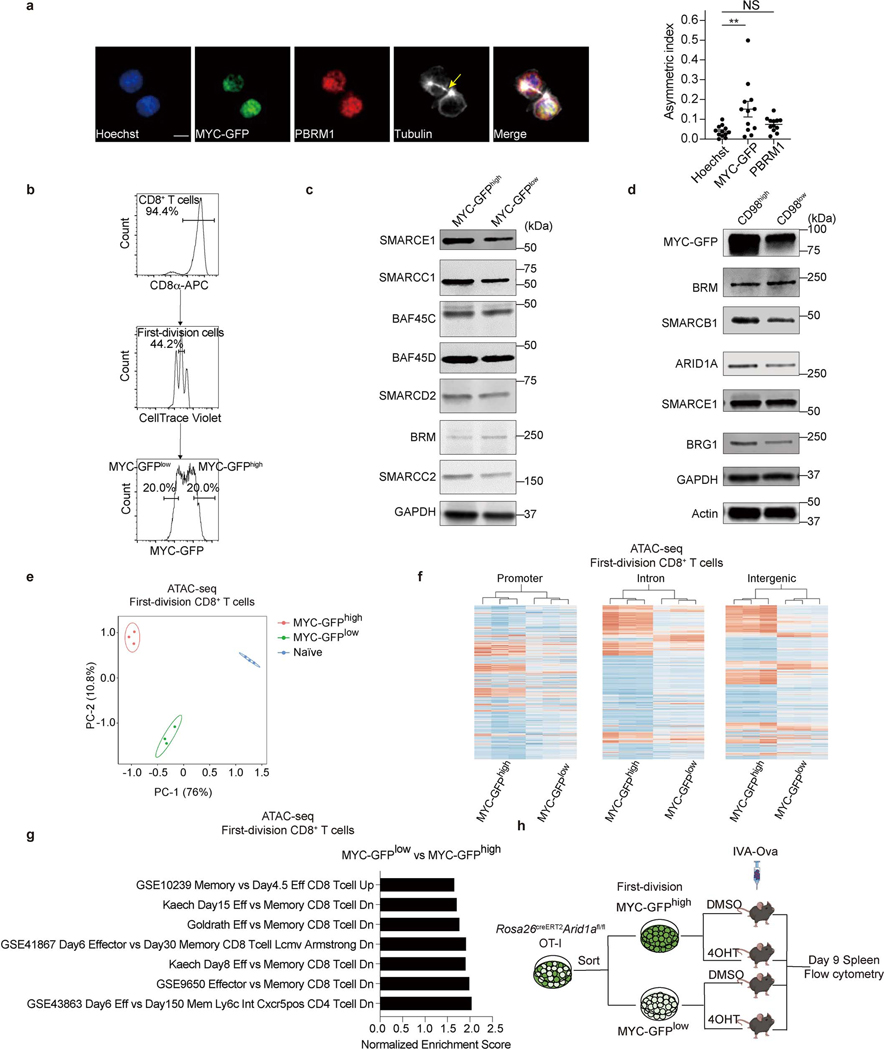
Extended Data Figure 4. cBAF components asymmetrically segregate to daughter cells during the first division after activation.
a, Representative images (left) of conjoined first-division daughter c-Myc-GFP-expressing CD8+ T cells, stained for Hoechst (blue), Pbrm1 (red) and Tubulin (white); and quantification (right) of asymmetric index (difference in fluorescence intensity/total) (n=12 cells). Arrows mark tubulin bridges. Scale bar: 5 μm. b, Sorting strategy for first-division c-Myc-GFPhi and c-Myc-GFPlo CD8+ T cells. Naïve CD8+ T cells were labeled with CellTrace Violet (CTV) and activated with anti-CD3ε (2 μg/ml), anti-CD28 (1 μg/ml) plus ICAM1 (0.5 μg/ml) for 36 hours prior to sorting. c, d, Immunoblot of BAF components in c-Myc-GFPhi and c-Myc-GFPlo (c) or CD98hi and CD98lo (d) first-division CD8+ T cells. e, Principal component analysis of the ATAC-seq data in sorted c-Myc-GFPhi and c-Myc-GFPlo daughter cells from first-division stage (n=3 biological replicates). f, Heatmap of open chromatin regions in sorted c-Myc-GFPhi and c-Myc-GFPlo CD8+ T cells at the promoter, intron and intergenic regions (n=3 biological replicates). g, TEFF and TMEM cell-associated gene sets identified by enrichment analysis of differentially accessible chromatin peaks between c-Myc-GFPhi and Myc-GFPlo CD8+ T cells (n=3 biological replicates). h, Diagram of deletion of Arid1a in sorted c-Myc-GFPhi and c-Myc-GFPlo OT-I cells prior to IAV-Ova infection (related to Fig. 2f, g). Data are representative of one (e−g) or at least two independent experiments (a, c, d). Data are shown as mean±s.e.m. **p < 0.01, ns, not significant; one-way ANOVA (a).

