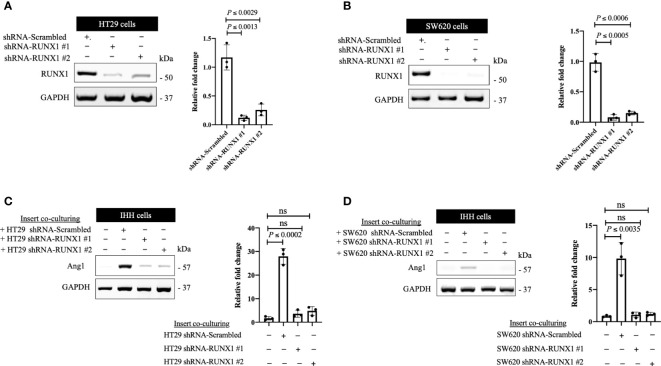
Figure 2.
The expression of RUNX1 in the cancer cells influences the expression of Ang1 in adjacent hepatocytes in vitro. (A, B) Immunoblotting showing the expression of RUNX1 in colorectal cancer (HT29 and SW620) cells (left panels). The right panels represent the intensity of RUNX1 bands after normalization with GAPDH using ImageJ. Data are from three independent experiments. (C, D) The left panels show the expression of Ang1 in the co-cultured IHH hepatocytes with colorectal cancer (HT29 and SW620) cells. The right panels show the intensity of Ang1 bands after normalization with GAPDH using ImageJ. Data are from three independent experiments. Data are presented as the mean ± SD. ns, Not significant.

