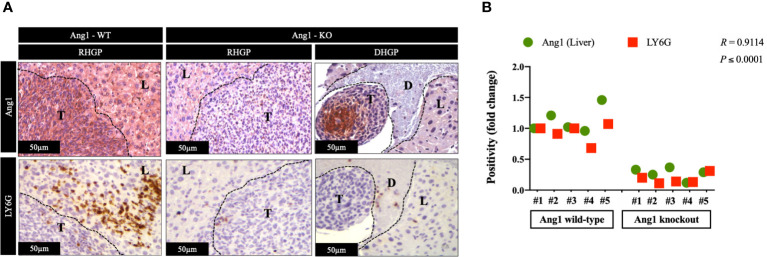
Figure 4.
The expression of Ang1 in the host liver positively correlated with neutrophil infiltration. (A) Represents immunohistochemical staining of CRCLM sections generated by injecting MC38 cancer cells into wild-type (n=5) and Ang1 knockout (n=5) C57BL/6 mice. We used anti-Ang1 and anti-LY6G (neutrophil biomarker) antibodies. (B) Pearson correlation analysis confirmed the correlation between Ang1 expression and LY6G expression in CRCLM sections. Relative expression levels of Ang1 or LY6G were calculated by dividing the positivity value of each specimen from Ang1-wild type (Ang1-WT) and Ang1-kncokout (Ang1-KO) groups by the positivity value of specimen #1 from Ang1-WT group and then presenting the result as a fold difference.

