
Fig.1. Quantitative ultrasound images obtained during elastography of Achilles tendon of patients with familial hypercholesterolemia.
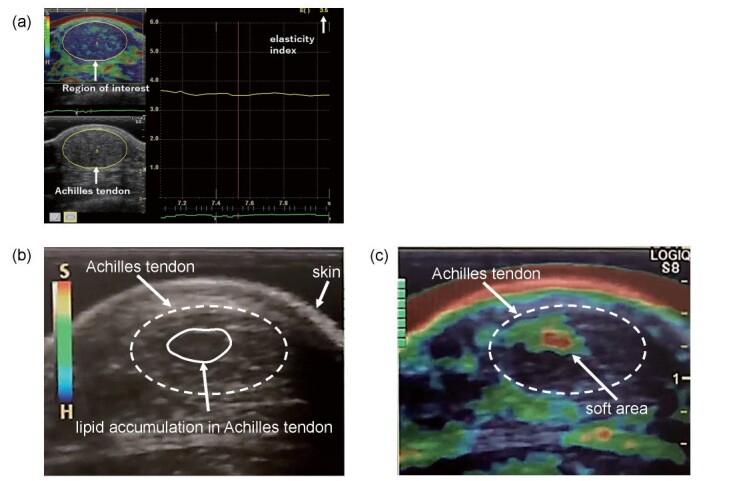
(a) Elastogram of a 44-year-old male patient with familial hypercholesterolemia. His AT thickness was 14.8 mm and EI was 3.5. Region of interest for Achilles tendon is defined as ellipse surrounded by yellow line.
(b) Horizontal sonogram of 24-year-old man with familial hypercholesterolemia. Ellipse surrounded by dotted line indicates Achilles tendon. Low-echoic lesions in Achilles tendon suggest lipid accumulation. His AT thickness was 8.7 mm and EI was 4.0.
(c) Elastogram of 24-year-old man with familial hypercholesterolemia (same patient as in Fig. 1(b)). A color map from blue (hardest tissue) to red (softest tissue) was produced in the strain elastogram. Red (softest tissue) was observed in the low-echoic area in B-mode (Fig. 1(b)).