FIGURE 5.
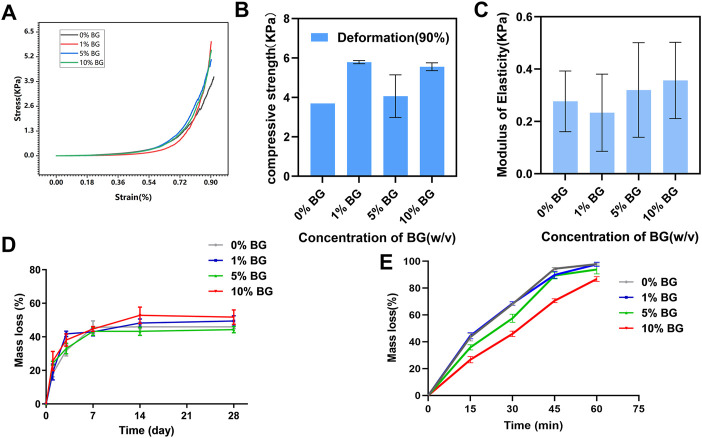
Mechanical and degradation properties of the biomimetic BG/GelMA scaffolds (A) Representative compressive stress–strain curve of the biomimetic BG/GelMA scaffolds. Grey: 0% BG group; Red: 1% BG group; Blue: 5% BG group; Green: 10% BG group; (B) Compressive strength of the scaffolds at the deformation of 90%; (C) Elastic modulus of the scaffolds. N = 3 samples per group; (D) In vitro degradation in PBS solution at 37°C and (E) enzymatic degradation of scaffolds 0% BG, 1% BG, 5% BG, and 10% BG. Grey: 0% BG group; Blue: 1% BG group; Green: 5% BG group; Red: 10% BG group; Data represent the mean ± SD, n = 3.

