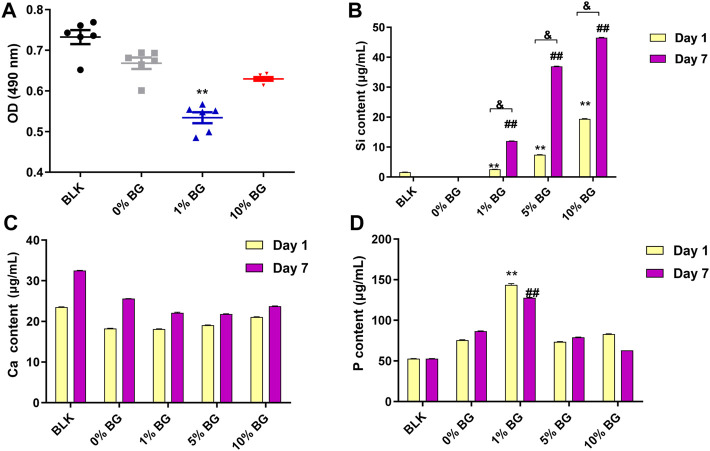
FIGURE 8.
Cell viability of HPDLCs by using MTS assay and the ion release of the biomimetic BG/GelMA scaffolds by ICP-MS (A) The OD (490 nm) values in the BLK (Blank: flat plate) group and the scaffolds 0% BG, 1% BG, and 10% BG groups on day 3; The Ca ion release (B), the Si ion release (C), and the P ion release in the BLK group and the scaffold 0% BG, 1% BG, and 10% BG groups on day 1 and day 7. The data represent the mean ± SD, n = 3. **,##,& p < 0.01. MTS: (3-(4,5-dimethylthiazol-2-yl)-5-(3carboxymethoxyphenyl)-2-(4-sulfophenyl)-2H-tetrazolium).

