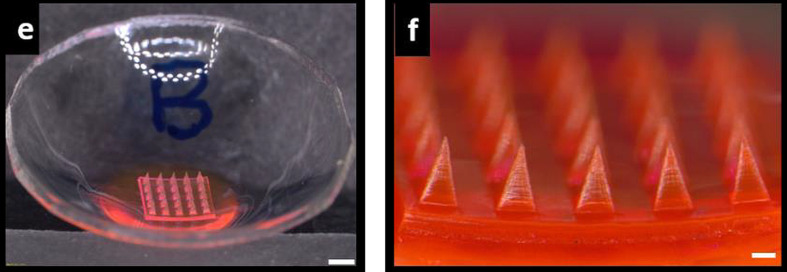
Figure 4.
Stereomicroscopic image of the microneedle patch (e) and magnification of the microneedles (f), scalebars represent 1 mm and 200 µm respectively. Figure 4 was reproduced from [160] (“Microneedle ocular patch: fabrication, characterization, and ex-vivo evaluation using pilocarpine as model drug”, by G. Roy et al., Drug Development and Industrial Pharmacy, published on 11 Jun 2020 by Taylor & Francis Ltd), reprinted by permission of the publisher (Taylor & Francis Ltd, http://www.tandfonline.com). This content is not subject to CC BY 4.0.

