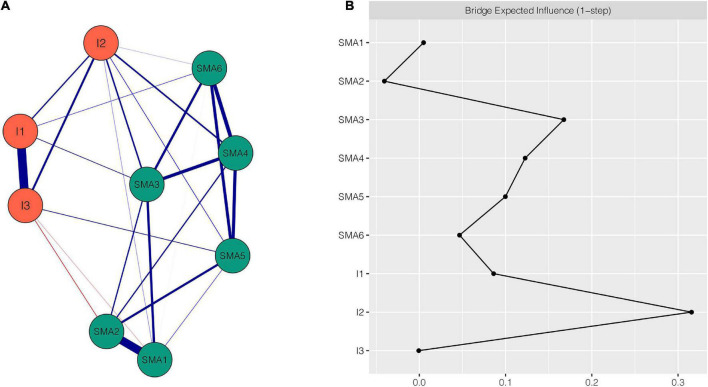
FIGURE 1.
Network structure of SMA-Impulsivity variables. (A) EBICglasso network. Blue edges represent positive correlations, red edges represent negative correlations. A thicker edge reflects higher correlation between the nodes. (B) Centrality plot depicting the bridge expected influence of each node in the network (raw value). SMA1, salience; SMA2, tolerance; SMA3, mood modification; SMA4, relapse; SMA5, withdrawal; SMA6, conflict; I1, non-planning impulsivity; I2, motor impulsivity; I3, attentional impulsivity.

