. 2022 Sep 1;28(21):4714–4723. doi: 10.1158/1078-0432.CCR-22-0749

Figure 4.

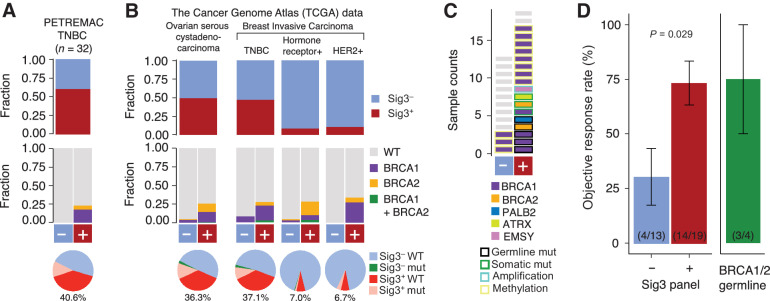
Figure 4. Fraction of samples that are Sig3+ (top), the proportion of samples with germline BRCA1/2mut for Sig3+ and Sig3− groups (middle) and pie charts showing the fraction of samples that are Sig3+ germline BRCA1/2 WT in TNBCs from PETREMAC trial (A) and TCGA ovarian cancers and the major clinical subtypes of breast cancer (B). The fraction of samples that are Sig3+ but not germline BRCA1/2mut are shown below the pie charts in red and the fractions are indicated below. Pink: Sig3+ and germline BRCA1/2mut, Green: Sig3− and germline BRCA1/2mut, and Blue Sig3− and germline BRCA1/2 WT. C, HR-gene alterations in patients from the PETREMAC trial. D, ORR from patients from the PETREMAC trial according to panel-Sig3 classification and etiology of Sig3. Error bars denote the SE. The number of samples and the responders are denoted in parenthesis. WT, wild type.

Fraction of samples that are Sig3+ (top), the proportion of samples with germline BRCA1/2mut for Sig3+ and Sig3− groups (middle), and pie charts showing the fraction of samples that are Sig3+ germline BRCA1/2 WT in TNBCs from PETREMAC trial (A) and TCGA ovarian cancers and the major clinical subtypes of breast cancer (B). The fraction of samples that are Sig3+ but not germline BRCA1/2mut are shown below the pie charts in red and the fractions are indicated below. Pink: Sig3+ and germline BRCA1/2mut, Green: Sig3− and germline BRCA1/2mut, and Blue Sig3− and germline BRCA1/2 WT. C, HR-gene alterations in patients from the PETREMAC trial. D, ORR from patients from the PETREMAC trial according to panel-Sig3 classification and etiology of Sig3. Error bars denote the SE. The number of samples and the responders are denoted in parenthesis. WT, wild type.