. 2022 Aug 25;15(11):755–766. doi: 10.1158/1940-6207.CAPR-22-0258

Figure 2.

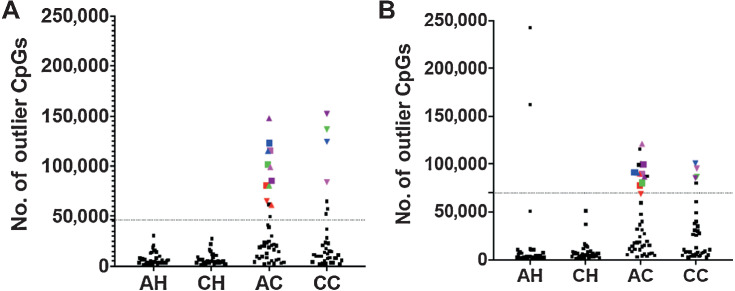
Figure 2. Identification of samples with OMP. Number of CpGs in which a sample is hypermethylated outlier (A) or Hypomethylated outlier (B). Dotted line indicates outlier boundary. Each symbol is a sample. Symbols above the dotted lines are outliers in respective plots. Colored symbols indicate samples that are outliers in both the plots and are termed as “OMPs”. Samples represented by colored symbols are OMPs. Same color and shape show the same individuals in both the plots.

Identification of samples with OMP. Number of CpGs in which a sample is hypermethylated outlier (A) or Hypomethylated outlier (B). Dotted line indicates outlier boundary. Each symbol is a sample. Symbols above the dotted lines are outliers in respective plots. Colored symbols indicate samples that are outliers in both the plots and are termed as “OMPs”. Samples represented by colored symbols are OMPs. Same color and shape show the same individuals in both the plots.