. 2022 Aug 25;15(11):755–766. doi: 10.1158/1940-6207.CAPR-22-0258

Figure 4.

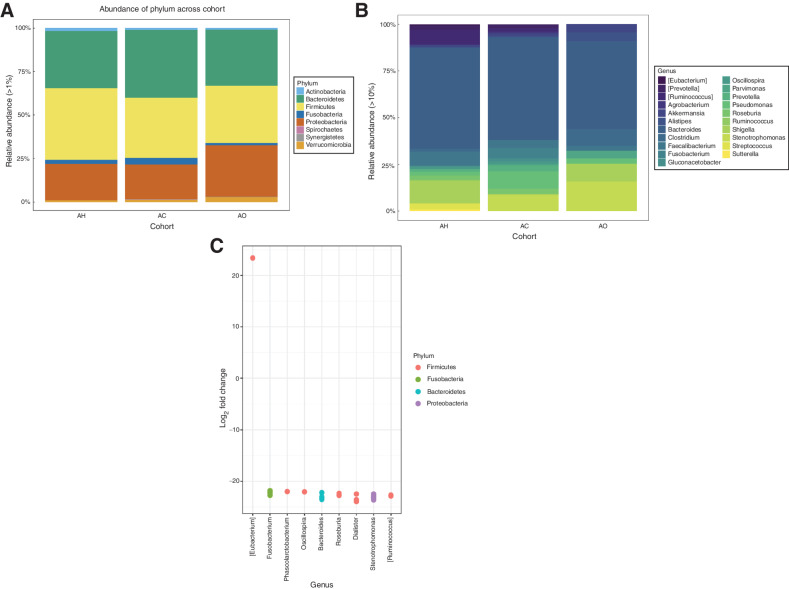
Figure 4. Analysis of the microbiome from AA samples. A, Taxonomic composition of colon tissue microbiomes at the phylum level. B, Taxonomic composition of colon tissue microbiomes at the genus level. C, Differential abundance analysis between microbiome samples of AC and AO cohorts. Each point represents ASV belonging to respective bacteria species. ASVs were considered significant if their false discovery rate-corrected P value was < 0.05. Multiple points visualized under the same genus represent ASVs that are classified within the same genus but differ by one or more nucleotides. Taxa in square brackets are annotations for proposed taxonomy supplied by the Greengenes database.

Analysis of the microbiome from AA samples. A, Taxonomic composition of colon tissue microbiomes at the phylum level. B, Taxonomic composition of colon tissue microbiomes at the genus level. C, Differential abundance analysis between microbiome samples of AC and AO cohorts. Each point represents ASV belonging to respective bacteria species. ASVs were considered significant if their false discovery rate-corrected P value was < 0.05. Multiple points visualized under the same genus represent ASVs that are classified within the same genus but differ by one or more nucleotides. Taxa in square brackets are annotations for proposed taxonomy supplied by the Greengenes database.