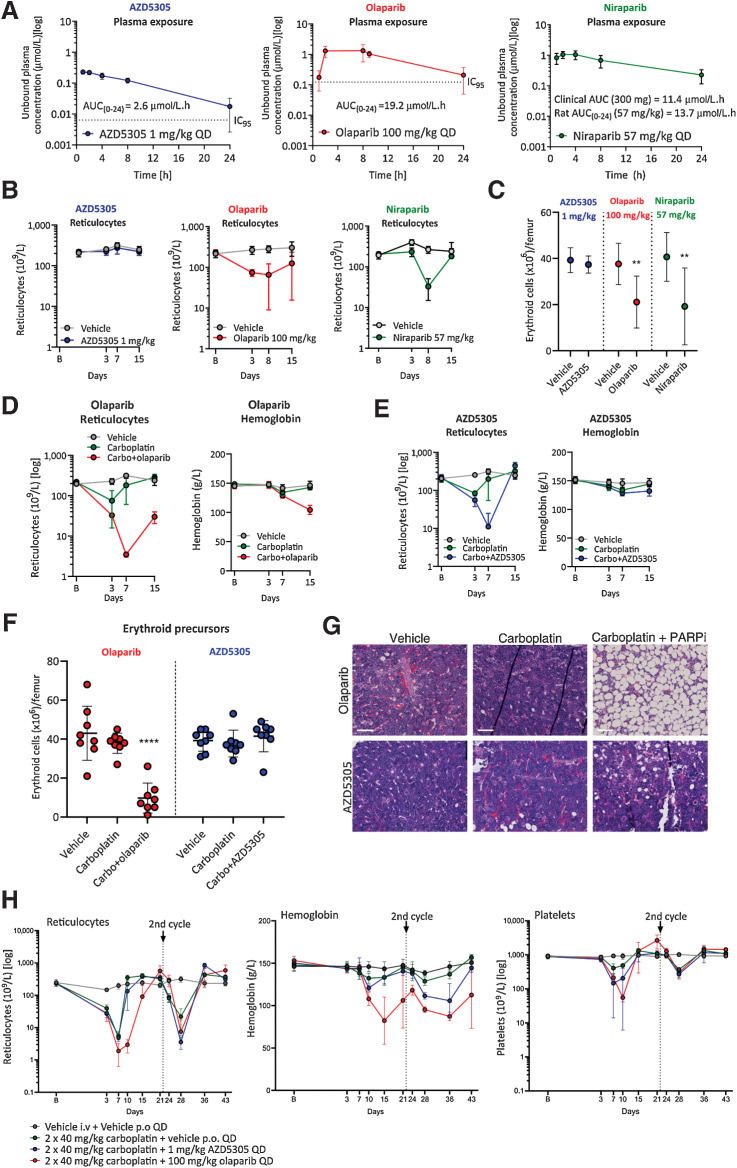
Figure 5.
AZD5305 has reduced hematological toxicity in monotherapy and combination with carboplatin in rat pre-clinical models, when compared to dual PARP1/2 inhibitors. Monotherapy (A–C): Rats were dosed once daily (QD) orally for 14 days with the compounds and doses indicated. A, Unbound plasma concentration of AZD5305 (blue; 1 mg/kg), olaparib (red; 100 mg/kg), and niraparib (green; 57 mg/kg) at steady-state on day 14 with resulting unbound AUCs as indicated. The dotted lines represent the efficacious IC95 (derived from the DLD-1 BRCA2−/− clonogenic assays) for AZD5305 and olaparib. B, Reticulocyte counts at baseline (B on x-axis) and at time points indicated, in animal groups treated with vehicle (gray), AZD5305 (blue), olaparib (red), or niraparib (green). C, Terminal erythroid precursor cell counts in AZD5305 (blue), olaparib (red), and niraparib (green) treatment groups as indicated by the legend. Statistical significance was tested relative to vehicle controls using a one-way ANOVA and Dunnett multiple comparison test, where **, P ≤ 0.01. Dots and error bars represent the mean of eight replicates ±SD. Combination (D-H): Rats were dosed with vehicle or once with intravenous (i.v.) carboplatin alone or in combination with PARPi QD for 14 days. D and E, Reticulocyte counts and hemoglobin levels are shown at baseline (B on x-axis) and over time (days; x-axis) for carboplatin+olaparib (red; D) or carboplatin+AZD5305 (blue; E) in comparison with vehicle (gray) and carboplatin controls (green). F, Terminal erythroid precursor cell counts on day (d) 15 for the groups indicated, with olaparib study groups in red and AZD5305 study groups in blue. Statistical significance was tested relative to vehicle controls using a one-way ANOVA and Dunnett multiple comparison test, where ****, P ≤ 0.0001. G, Representative hematoxylin and eosin (H&E)-stained sections of bone marrow from vehicle controls, olaparib and AZD5305 monotherapy, and carboplatin+PARPi treatment groups as indicated. H, Reticulocyte, hemoglobin, and platelet levels over time (days; x-axis) from rats treated with vehicle (gray) or two doses of i.v. carboplatin alone (green) or in combination with continuous daily (QD) AZD5305 (blue) or olaparib (red) as indicated. All error bars represent the standard deviation of the mean of eight (A–C) or four (E) replicates.

