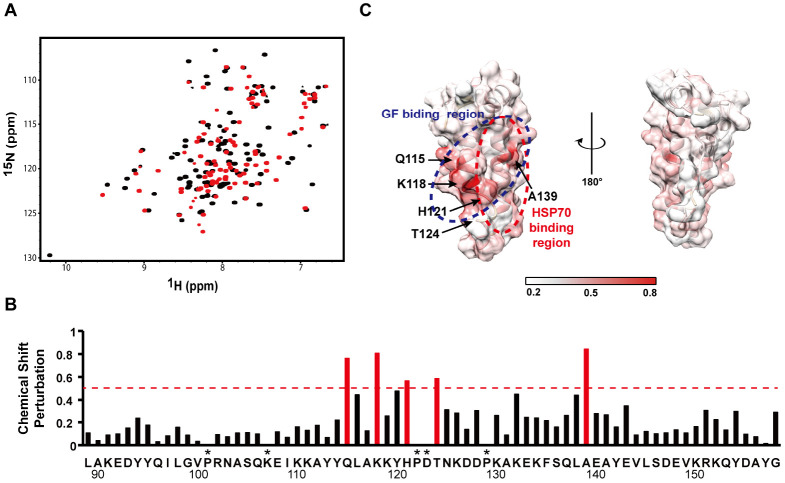
Fig. 3.
Identification of GF-motif-interacting region in JD. (A) Comparison of 2D [1H-15N]HSQC NMR spectrum between JD (red) and JDGF (black). (B) Chemical shift perturbation (CSP) in JD region caused by the GF-motif interaction. The most significantly (> 0.45) perturbed chemical shifts are indicated in red. (C) Mapping of the GF-motif-interaction site on the surface of the JD structure. The GF-motif- and Hsp70-interacting regions are indicated by dotted circles in blue and red, respectively. CSP values are coordinated from white to red colors. Asterisks indicate the residues for which CSPs were not available due to missing assignments.

