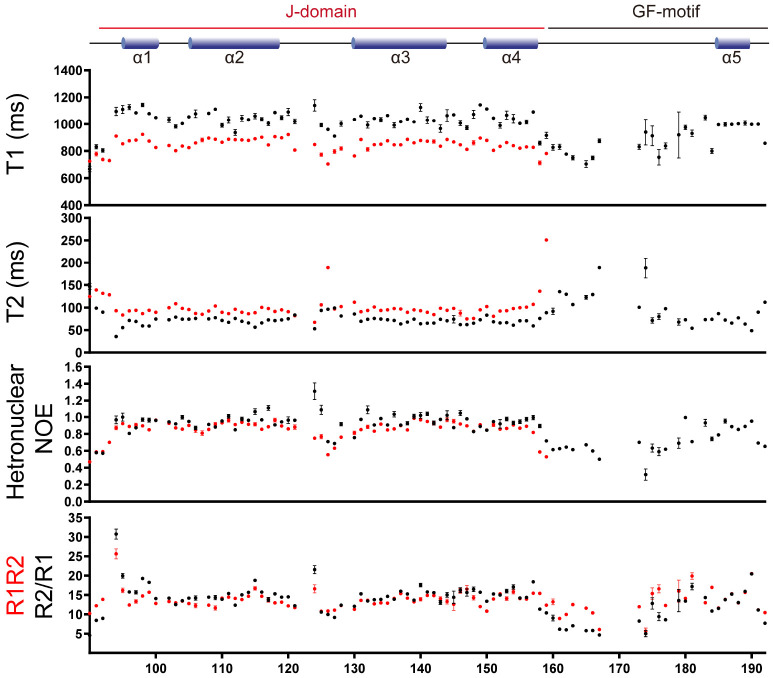
Fig. 4.
NMR relaxation dynamics of Tid1 JD and JDGF. Red and black circles in the T1, T2, and heteronuclar NOE analysis indicate the values for JD and JDGF, respectively. The R1R2 (black) and R2/R1 (red) values are for JDGF. Mean values of R1R2 (14.0) and R2/R1 (14.8) are indicated by dashed lines in black and red, respectively.

