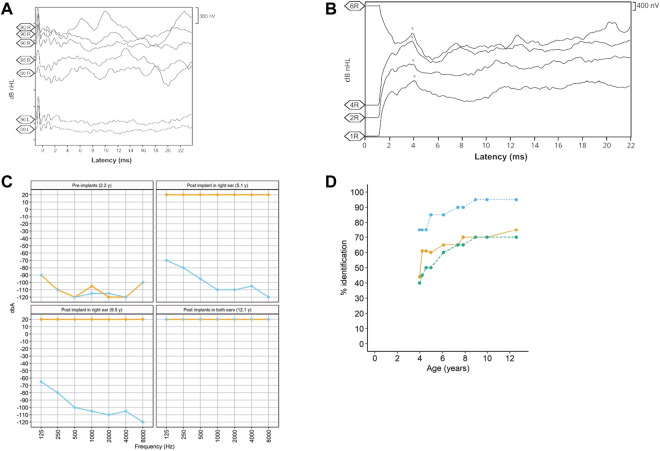
FIGURE 2.
(A) Auditory brainstem potential performed at an age of 1 year, showing the potentials performed in both the right (R) and left (L) ears at different dB HL (90, 85, and 80) levels. (B) Auditory brainstem potential performed at an age of 13 years using the implanted electrode in the right ear. The V-wave curve (v) recorded from the electrodes 1, 2, 4, and 6 of the cochlear implant in the right ear (R). (C). Pre- and post-implant audiometries showing the age when performed. Orange = right ear and sky blue = left ear. (D). Evolution of the auditory and speech perception tests over patient age. The panel shows the percentage of word discrimination at 60 dB (bluish green-dashed line and dots), the percentage of consonant identification (the orange solid line and dots), and the percentage of vowel identification at 60 dB (the sky blue dotted line and dots) at tested ages.

