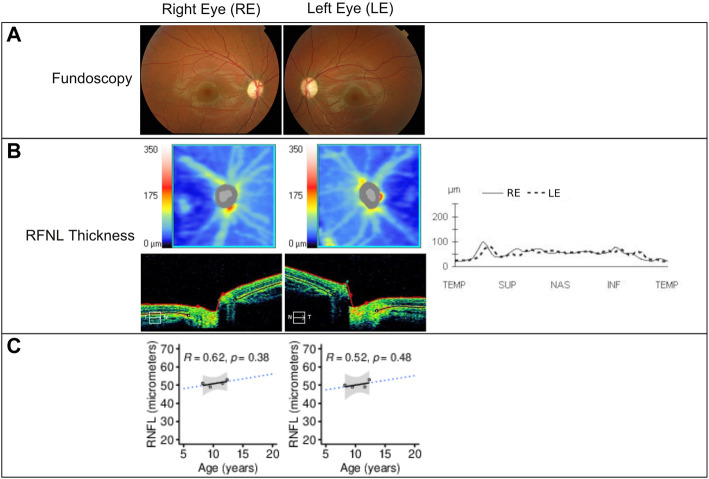
FIGURE 3.
(A) Fundoscopy showing optic nerve pallor and bilateral atrophy. (B) Retinal nerve fiber layer (RNFL) analysis by time-domain optical coherence tomography of both eyes at 12.3 years of age using Cirrus HD-OCT and SW Ver 11.5.254532 (Carl Zeiss Meditec), showing from the top to bottom the RNFL thickness maps and the nasal (N) to temporal (T) quadrants’ extracted tomographs. Graphical representation of the RNFL thickness from all quadrants is also shown at the right of the images. (C) RNFL thickness (in micrometers) in function of the patient’s age showing linear regression (black solid line), 95% confidence interval (gray area), and prediction outside measured ages (blue dotted line). The Pearson correlation coefficient and p-value are shown in each panel. RE = right eye; LE = left eye; µm = micrometers.

