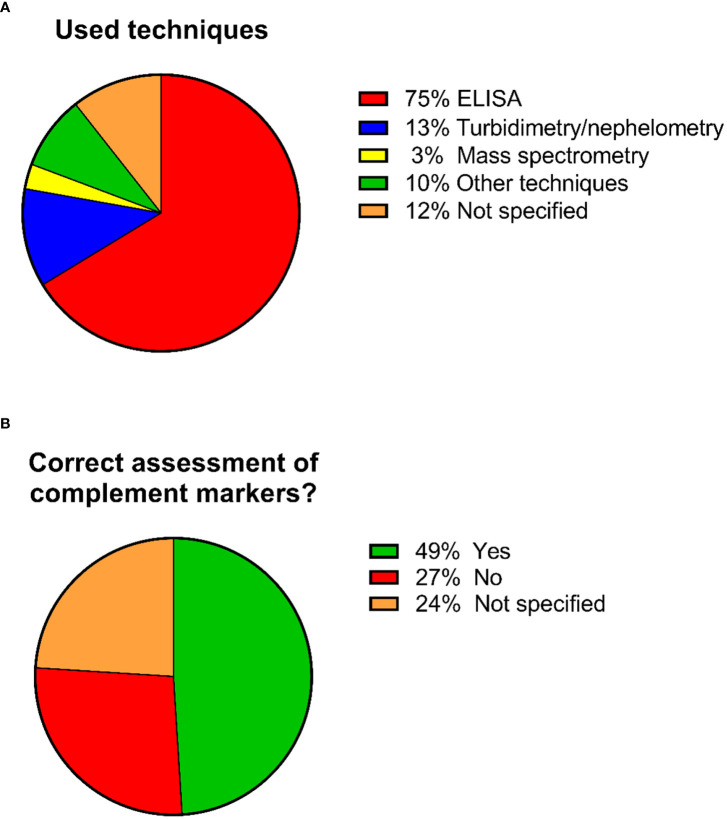
Figure 4.
Pie charts showing the percentages regarding the used techniques and whether the correct sample types were used for complement assessment. A total of 92 studies were included in the analysis. (A) Percentages regarding the used techniques. Several studies used more than 1 technique for their measurements, hence the number of performed analyses is higher than the total number of the identified studies. (B) Percentages of studies that used/did not used the correct sample type for complement assessment.

