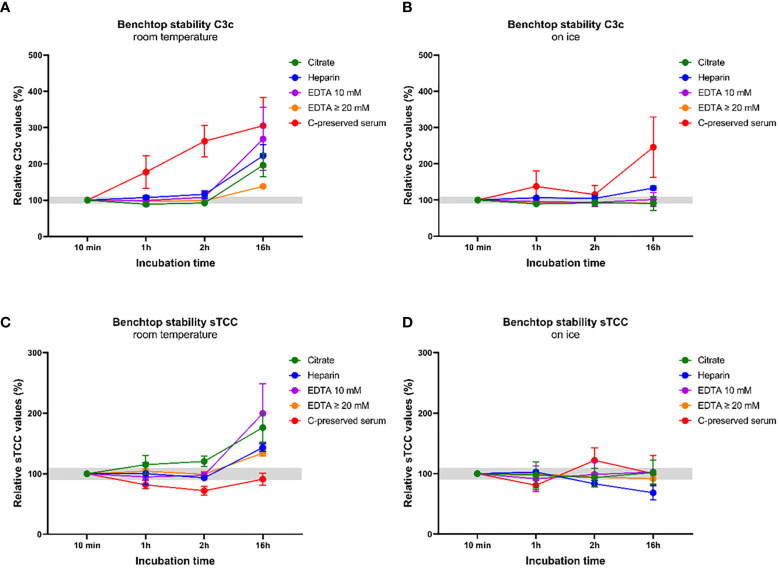
Figure 5.
Benchtop stability of the components C3c and soluble TCC in serum samples and in plasma samples with different anticoagulants. C3c and sTCC levels were measured in complement-preserved serum samples (n=5) and in plasma samples anticoagulated either with citrate, heparin, EDTA 10 mM and EDTA ≥20 mM (n=5 for each anticoagulant). All samples were thawed and incubated at RT or on ice for 10 min, 1h, 2h and 16h before measurements. (A) C3c levels measured after incubation at RT and (B) on ice. (C) sTCC levels measured after incubation at RT and (D) on ice. Samples were analyzed using a serial dilution ranging from 1:50 to 1:400 and data are represented as mean ± SEM. Deviation from baseline ≤10% is highlighted in grey.

