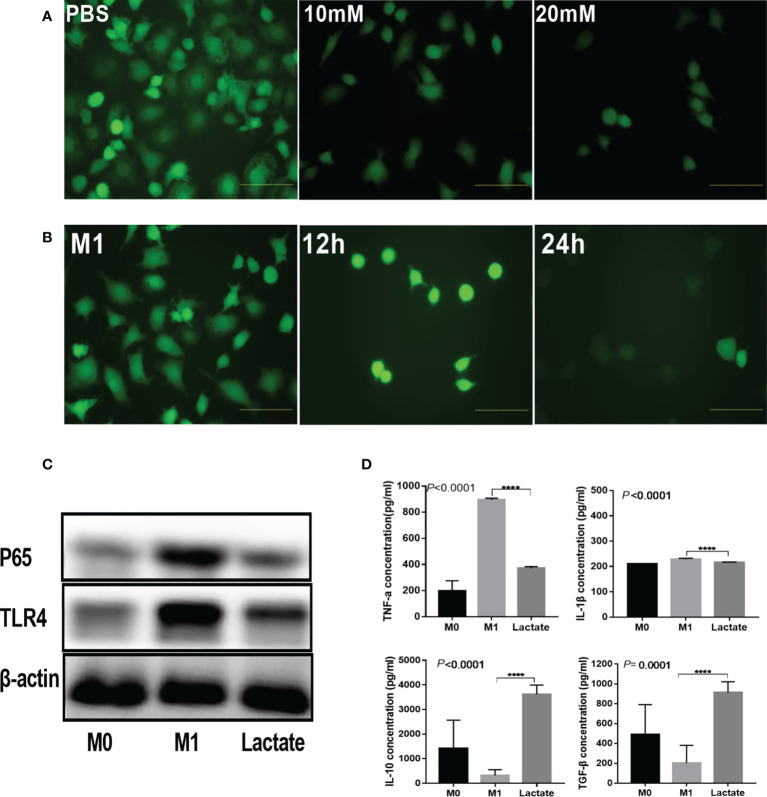
Figure 2.
Lactate inhibited inflammation in vitro. (A) Intracellular ROS generation was observed using a ROS fluorescence probe DCFH-DA after lactate treatment (n = 3). scale bar, 5μm. (B) Intracellular ROS generation by macrophages at different time points (n = 3). scale bar, 5μm. (C) Western blotting results showing expression of phenotypic markers of LPS-stimulated macrophages after lactate treatment (n = 3). (D) Inflammatory cytokines released by macrophages in different treatment groups determined by ELISA (n=6). Pro-inflammatory cytokines, TNF-α and IL-1β; Anti-inflammatory factors, TGF-β and IL-10.

