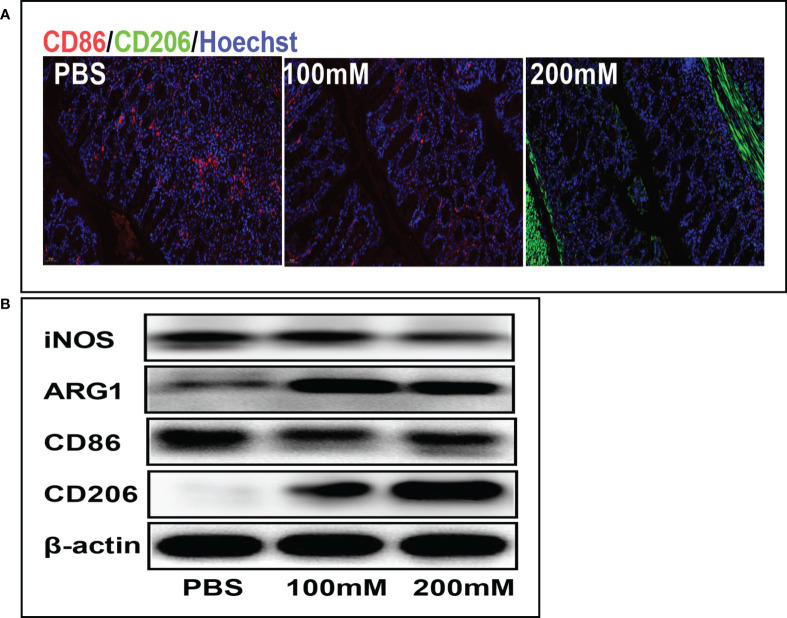
Figure 5.
Lactic acid promoted M2 polarization of macrophages in colon tissues. (A) Representative fluorescent images of the macrophage phenotypes in colon tissues in different groups. Scale bar, 100μm. (B) Western blotting analysis showing expression level of macrophage phenotypic markers in colon tissues for different groups.

