Figure 3.

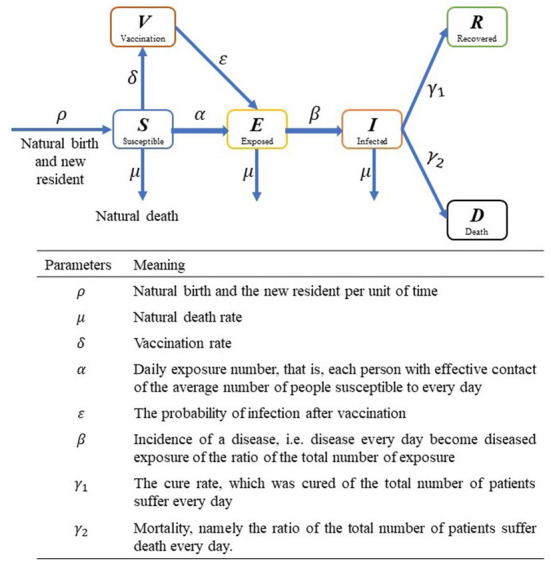
Illustration of compartmental model. S, E, I, R, D and V represent susceptible, exposed, infected, recovered, death and vaccination people, respectively.

Illustration of compartmental model. S, E, I, R, D and V represent susceptible, exposed, infected, recovered, death and vaccination people, respectively.